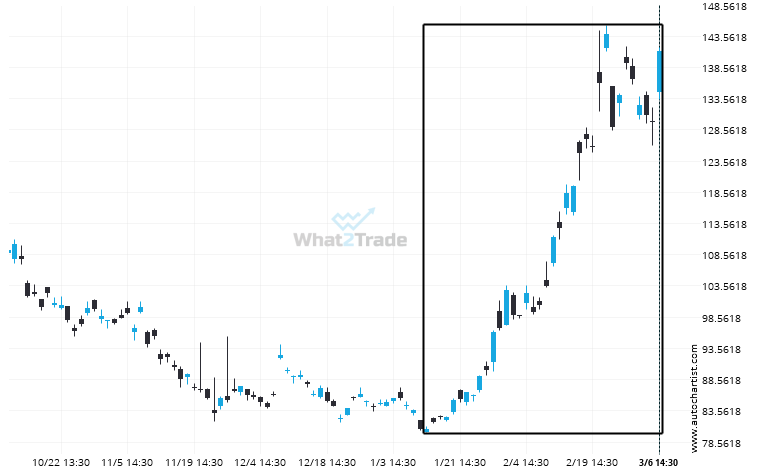
BABA rose sharply for 52 days – which is an excessively big movement for this instrument; exceeding the 98% of past price moves. Even if this move is a sign of a new trend in BABA there is a chance that we will witness a correction, no matter how brief.
Related Posts
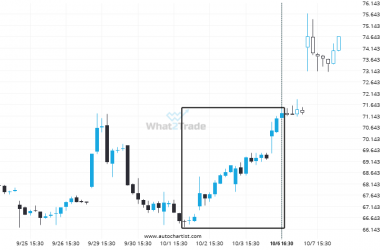
Big bullish swing on PYPL – this may be one of its more notable movements in the recent session.
PYPL reached 71.24 after a 7.18% move spanning 5 days.
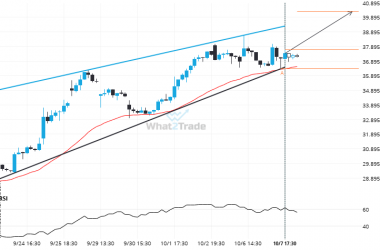
INTC formed a Rising Wedge on the 1 hour chart. Retest of resistance in sight.
Emerging Rising Wedge pattern in its final wave was identified on the INTC 1 hour chart. After a…
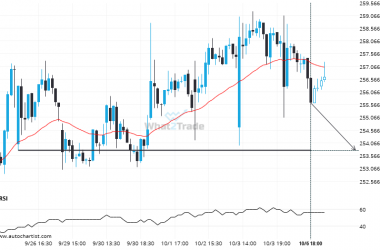
AAPL likely to test 253.7800 in the near future. Where to next?
AAPL is approaching a support line at 253.7800. If it hits the support line, it may break through…


