


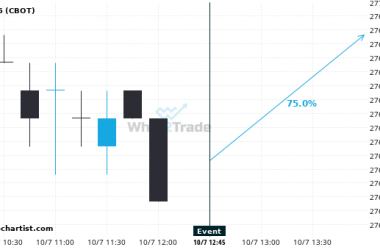
We expect a $1714 movement on SM within the next 2 hours.
Based on past Canada Balance of Trade news events there is a 75% chance of SM trending upwards.…
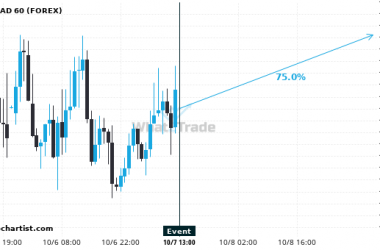
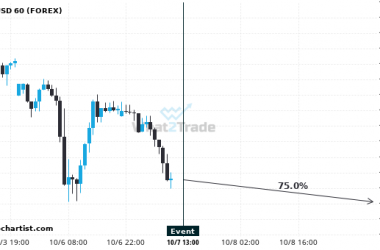
We expect USDCAD to trend upwards with a 75% chance.
Based on the last 12 Balance of Trade events in Canada, USDCAD may trend upwards for the next…
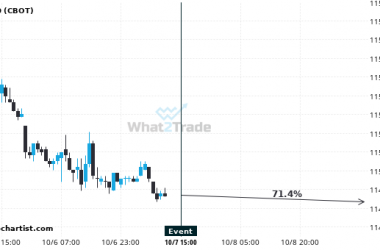
There is a 71.43% chance of TN trending downwards
Based on the last 12 Ivey PMI s.a events in Canada, we expect TN to trend downwards later…
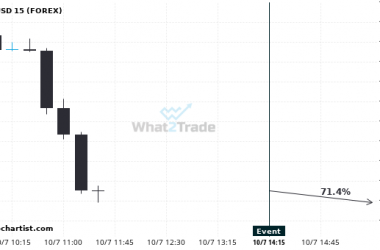
We expect GBPUSD to trend downwards today.
Based on the last 12 Ivey PMI s.a events in Canada, we expect a 20 pip movement on…
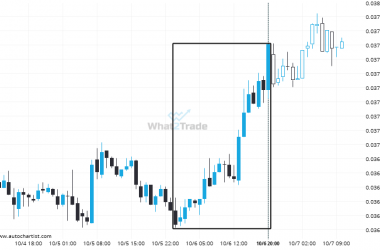
A very large move was recorded on ETHBTC. The size of the shift is exceptional.
ETHBTC has moved higher by 3.48% from 0.03646 to 0.03773 in the last 20 hours.

Will US Oil break through the resistance level it tested before?
US Oil is moving towards a key resistance level at 62.0110. This is a previously tested level for…

After testing 24489.3008 numerous times, DAX 40 is once again approaching this price point. Can we expect a bullish trend to follow?
The movement of DAX 40 towards 24489.3008 price line is yet another test of the line it reached…
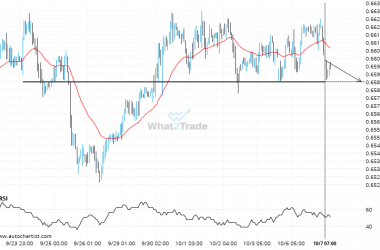
AUDUSD likely to test 0.6584 in the near future. Where to next?
AUDUSD is en route to a very important line that will be a definite deciding factor of what…
We expect EURUSD to trend downwards today with a 75% chance.
Based on the last 12 Balance of Trade events in Canada, we expect EURUSD to trend downwards later…
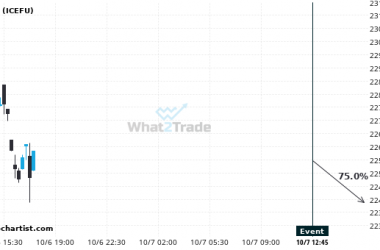
We expect OJ to trend downwards today with a 75% chance.
Based on the last 12 Balance of Trade events in Canada, we expect OJ to trend downwards later…