Autochartist
42979 posts
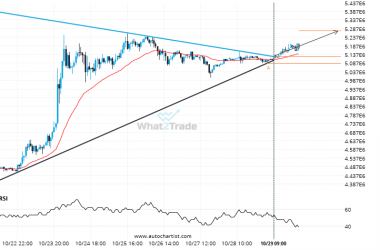
BTCJPY a traversé la résistance d’un Triangle. Il a touché cette ligne au mois deux fois dans les 8 derniers jours.
BTCJPY a franchi la ligne resistance. Il a touché cette ligne au moins deux fois au cours des…
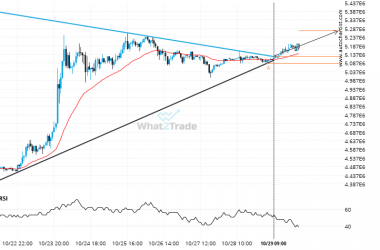
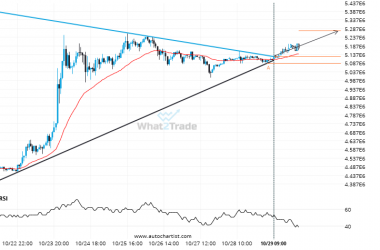
BTCJPY has broken through resistance of a Triangle. It has touched this line at least twice in the last 8 days.
BTCJPY has broken through a resistance line. It has touched this line at least twice in the last…
El BTCJPY ha atravesado la resistencia de Triángulo. Ha llegado a esta línea por lo menos dos veces en 8 días.
El BTCJPY atravesó una línea de resistencia. Ha entrado en contacto con esta línea por lo menos dos…
US30 a subi une très grosse baisse pendant 12 jours jusqu’à 32475.0
US30 a baissé de 4,79% de 34110.0 à 32475.0 dans les 12 derniers jours.
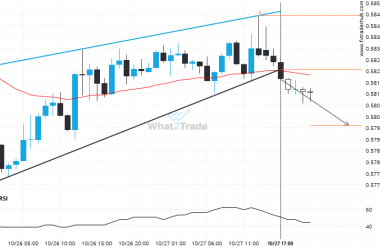
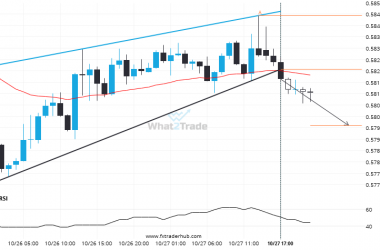
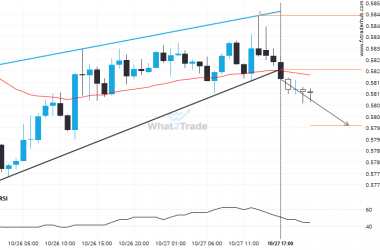
NZD/USD has broken through support of a Rising Wedge. It has touched this line at least twice in the last 3 days.
NZD/USD has broken through a support line. It has touched this line at least twice in the last…
El NZD/USD ha atravesado el soporte de Cuña ascendente. Ha llegado a esta línea por lo menos dos veces en 3 días.
El NZD/USD atravesó una línea de soporte. Ha entrado en contacto con esta línea por lo menos dos…
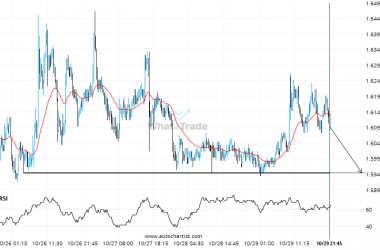
XRPBTC – approaching a price line that has been previously tested numerous times in the past
XRPBTC is moving towards a support line. Because we have seen it retrace from this level in the…
NZD/USD a traversé le support d’un Pointe Montante. Il a touché cette ligne au mois deux fois dans les 3 derniers jours.
NZD/USD a franchi la ligne support. Il a touché cette ligne au moins deux fois au cours des…
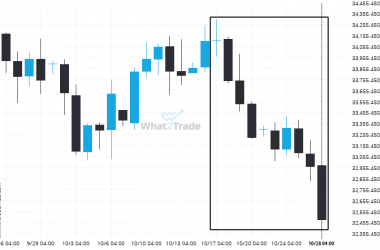
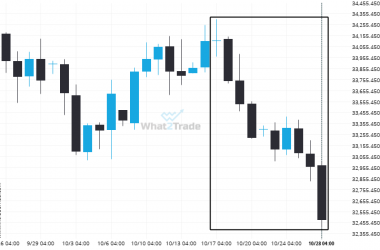
US30 experienced a very large 12 days bearish move to 32475.0
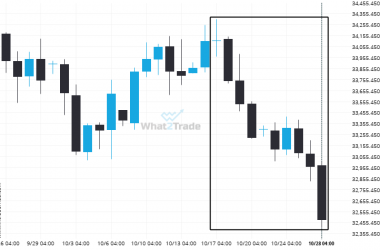
US30 has moved lower by 4.79% from 34110.0 to 32475.0 in the last 12 days.
El US30 experimentó en 12 días una baja al 32475.0
El US30 ha descendido un 4,79% de 34110.0 a 32475.0 en 12 días.

