Autochartist
42979 posts
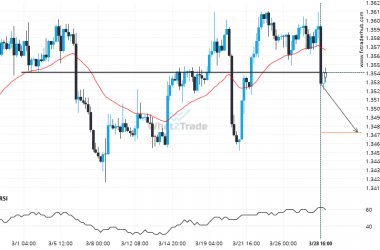
USD/CAD is currently testing a level of 1.3545. Will the breakout continue or will things reverse?
USD/CAD is once again retesting a key horizontal support level at 1.3545. It has tested this level 6…
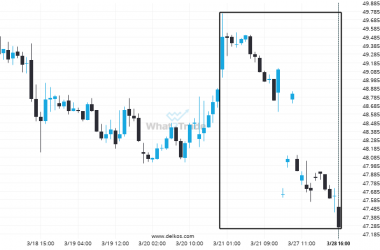
Is the extremely large movement on Soybean Oil May 2024 a sign of things to come?
An unexpected large move has occurred on Soybean Oil May 2024 1 hour chart beginning at 49.48 and…
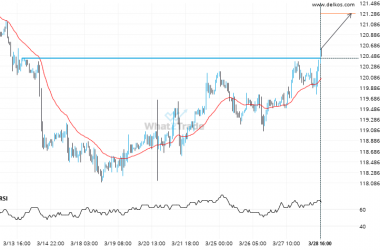
Breach of 120.4375 could mean a start of a bullish trend on Us Treasury Bond June 2024
Us Treasury Bond June 2024 has broken through a line of 120.4375 and suggests a possible movement to…
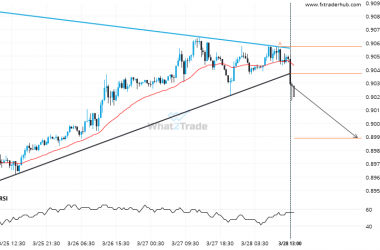
USD/CHF breakout from a Triangle trade setup. Will it continue this trend to hit the target price?
The breakout of USD/CHF through the support line of a Triangle could be a sign of the road…
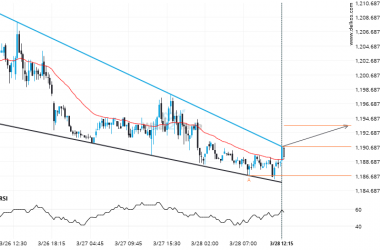
Soybeans May 2024 through 1190.75. Is this a confirming a breakout? Will it continue its path in the current trend toward 1193.6635?
Soybeans May 2024 moved through the resistance line of a Falling Wedge at 1190.75 on the 15 Minutes…
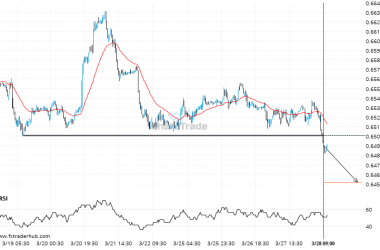
Breach of 0.6504 could mean a start of a bearish trend on AUD/USD
AUD/USD has broken through a line of 0.6504. If this breakout holds true, we could see the price…
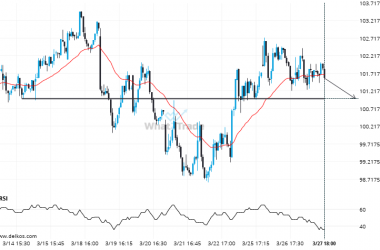
Lean Hogs June 2024 heading towards a price it has tested 6 times in the recent past.
Lean Hogs June 2024 is moving towards a line of 101.0000 which it has tested numerous times in…
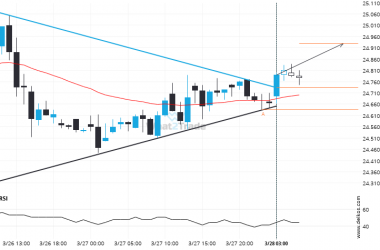
After testing resistance twice in the past, Silver May 2024 has finally broken through. Can we expect a bullish trend to follow?
This trade setup on Silver May 2024 is formed by a period of consolidation; a period in which…
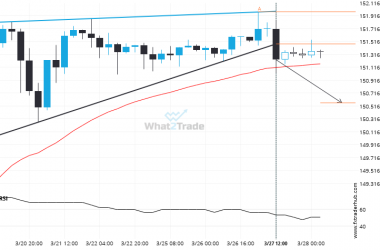
Support line breached by USD/JPY. This price has been tested at least twice before.
USD/JPY has broken through a support line of a Pennant chart pattern. If this breakout holds true, we…
NZD/USD – breach of price line that’s been previously tested numerous times before
The breakout of NZD/USD through the 0.5997 price line is a breach of an important psychological price that…

