Autochartist
42979 posts
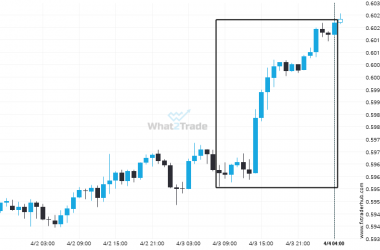
NZD/USD experienced a very large 20 hours bullish move to 0.60259
NZD/USD has moved higher by 1.01% from 0.59654 to 0.60259 in the last 20 hours.
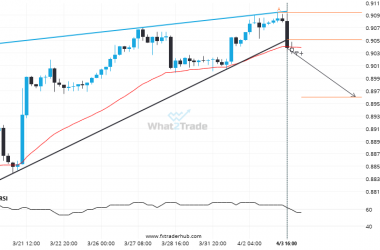
Interesting opportunity on USD/CHF after breaking 0.9052384782608696
USD/CHF has broken through a support line of a Rising Wedge chart pattern. If this breakout holds true,…
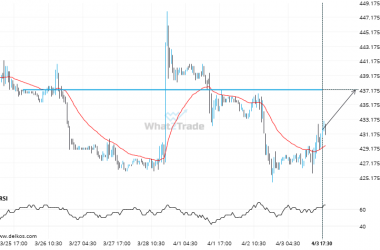
Will Corn May 2024 break through the resistance level it tested before?
Corn May 2024 is moving towards a resistance line. Because we have seen it retrace from this level…
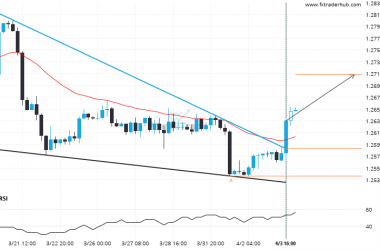
There is a possibility of a big movement on GBP/USD after a breach of the resistance
Falling Wedge pattern identified on GBP/USD has broken through a resistance level with the price momentum continuing to…
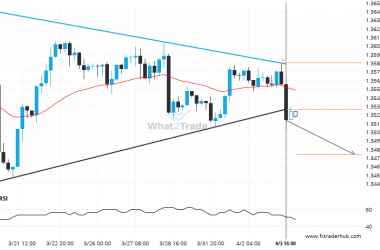
After testing support twice in the past, USD/CAD has finally broken through. Can we expect a bearish trend to follow?
This trade setup on USD/CAD is formed by a period of consolidation; a period in which the price…
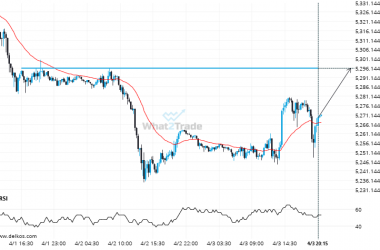
Will E-Mini S&P 500 June 2024 break through the resistance level it tested before?
E-Mini S&P 500 June 2024 is heading towards a line of 5296.2500. If this movement continues, the price…
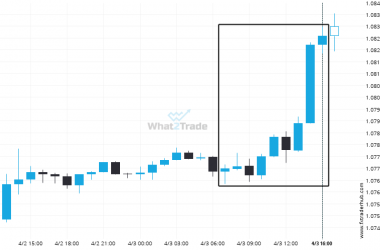
EUR/USD experienced a very large 9 hours bullish move to 1.08267
Those of you that are trend followers are probably eagerly watching EUR/USD to see if its latest 0.52%…
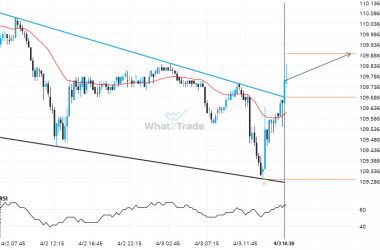
Resistance line breached by 10 Yr Us Treasury Note June 2024. This price has been tested at least twice before.
10 Yr Us Treasury Note June 2024 moved through the resistance line of a Falling Wedge at 109.686286407767…
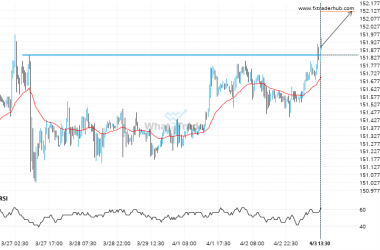
After testing 151.8410 numerous times, USD/JPY has finally broken through. Can we expect a bullish trend to follow?
USD/JPY has broken through a line of 151.8410 and suggests a possible movement to 152.1229 within the next…
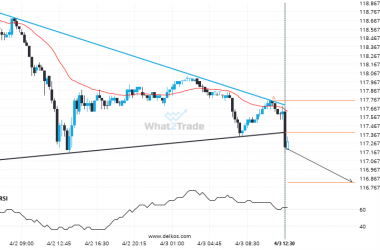
Us Treasury Bond June 2024 has broken out from the Triangle pattern. Expect it to hit 116.8189 soon.
This trade setup on Us Treasury Bond June 2024 is formed by a period of consolidation; a period…

