Autochartist
42979 posts
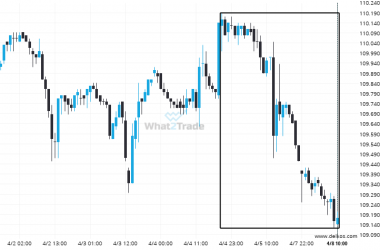
Extreme movement experienced on 10 Yr Us Treasury Note June 2024. Check this chart to see what to do next
10 Yr Us Treasury Note June 2024 has experienced an exceptionally large movement lower by 0.89% from 110.15625…
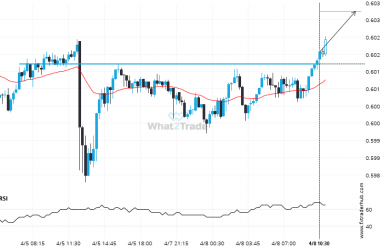
It’s time to make a decision on NZD/USD – its recent breach of 0.6020 could be a sign of a new trend to follow.
NZD/USD is once again retesting a key horizontal resistance level at 0.6020. It has tested this level 4…
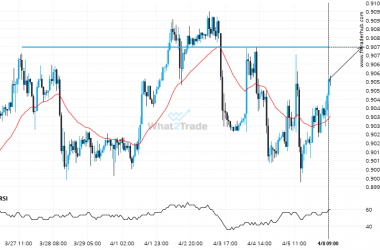
USD/CHF keeps moving closer towards 0.9075. Will it finally breach this level?
USD/CHF is heading towards 0.9075 and could reach this point within the next 2 days. It has tested…
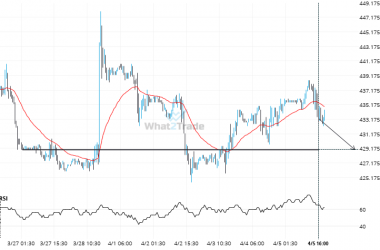
Corn May 2024 keeps moving closer towards 429.0000. Will it finally breach this level?
A strong support level has been identified at 429.0000 on the 30 Minutes Corn May 2024 chart. Corn…
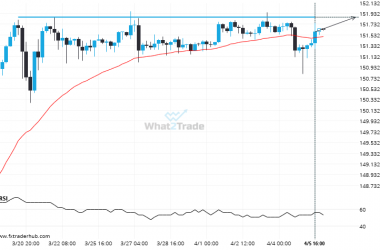
USD/JPY is approaching 151.8640. We expect either a breakout through this line, or a rebound.
A strong resistance level has been identified at 151.8640 on the 4 hour USD/JPY chart. USD/JPY is likely…
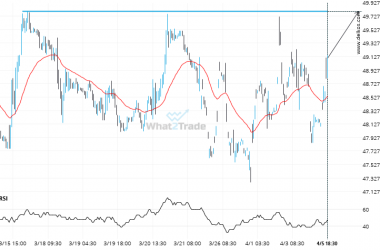
Soybean Oil May 2024 – approaching a price line that has been previously tested numerous times in the past
Soybean Oil May 2024 is heading towards 49.8000 and could reach this point within the next 2 days.…
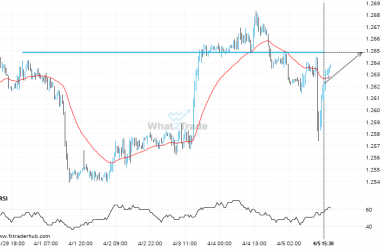
GBP/USD likely to test 1.2649 in the near future. Where to next?
GBP/USD is approaching a resistance line at 1.2649. If it hits the resistance line, it may break through…
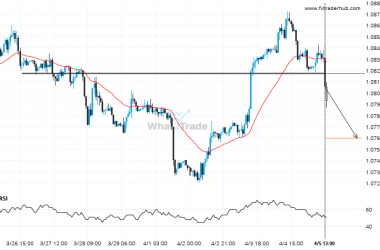
EUR/USD – breach of price line that’s been previously tested numerous times before
EUR/USD has broken through 1.0821 which it has tested numerous times in the past. We have seen it…
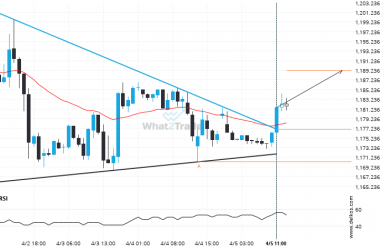
Soybeans May 2024 has broken out from the Triangle pattern. Expect it to hit 1189.2221 soon.
Soybeans May 2024 has broken through the resistance line of a Triangle technical chart pattern. Because we have…
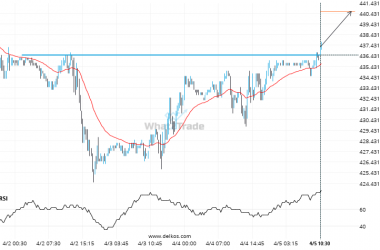
If you’re short Corn May 2024 you should be aware that 436.5000 has just been breached – a level tested 4 time in the past
Corn May 2024 has broken through a line of 436.5000 and suggests a possible movement to 440.6250 within…

