Autochartist
42979 posts
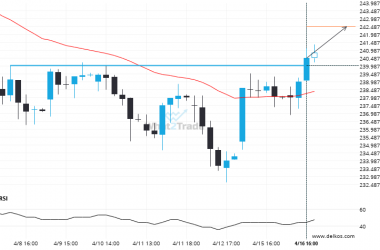
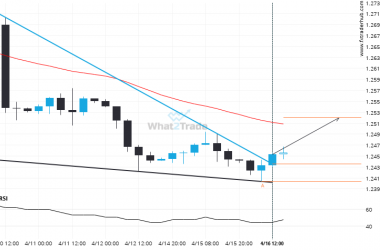
Feeder Cattle May 2024 is currently testing a level of 240.0000. Will the breakout continue or will things reverse?
Feeder Cattle May 2024 has broken through a line of 240.0000 and suggests a possible movement to 242.4625…
After testing resistance twice in the past, GBP/USD has finally broken through. Can we expect a bullish trend to follow?
The breakout of GBP/USD through the resistance line of a Falling Wedge could be a sign of the…
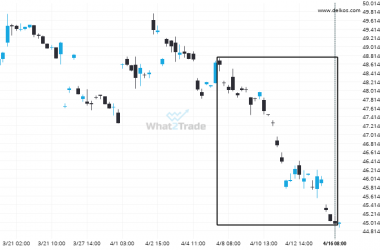
Soybean Oil May 2024 hits 44.97 after a 7.45% move spanning 11 days
Soybean Oil May 2024 dropped sharply for 11 days – which is an excessively big movement for this…
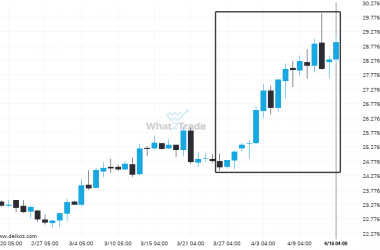
Could a large bullish move on Silver May 2024 be a sign of things to come?
An unexpected large move has occurred on Silver May 2024 Daily chart beginning at 24.56 and ending at…
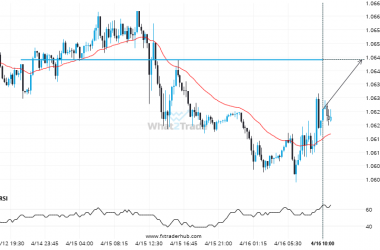
If EUR/USD touches 1.0647 it may be time to take action.
EUR/USD is approaching a resistance line at 1.0647. If it hits the resistance line, it may break through…
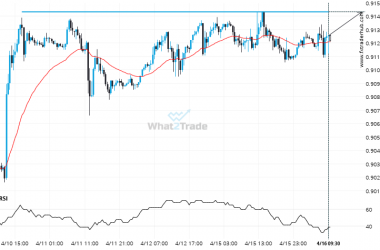
Supports and resistances are primary concepts of technical analysis. USD/CHF is heading for an important price of 0.9152 – read about what this could mean for the future.
USD/CHF is about to retest a key horizontal resistance level near 0.9152. It has tested this level 5…
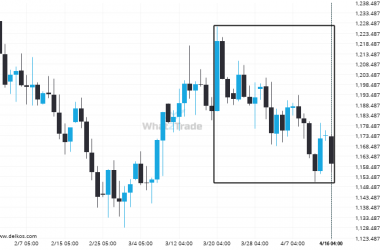
Soybeans May 2024 hits 1159.75 after a 4.9% move spanning 28 days
A movement of 4.9% over 28 days on Soybeans May 2024 doesn’t go unnoticed. You may start considering…
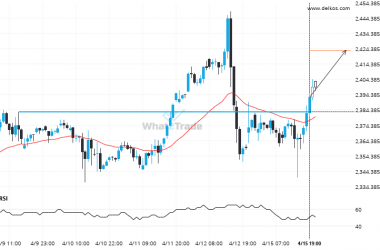
Breach of 2383.1001 could mean a start of a bullish trend on Gold June 2024
Gold June 2024 has breached the resistance line at 2383.1001. It may continue the bullish trend towards 2423.4500,…
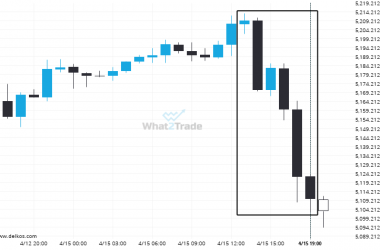
Extreme movement experienced on E-Mini S&P 500 June 2024. Check this chart to see what to do next
E-Mini S&P 500 June 2024 has experienced an extremely big movement in last 6 hours. It may continue…
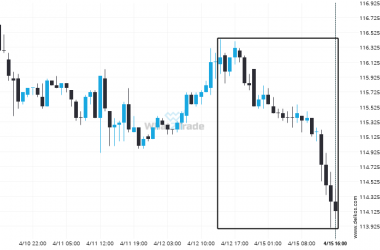
Is the extremely large movement on Us Treasury Bond June 2024 a sign of things to come?
Us Treasury Bond June 2024 has experienced an exceptionally large movement lower by 1.78% from 116.1875 to 114.125…

