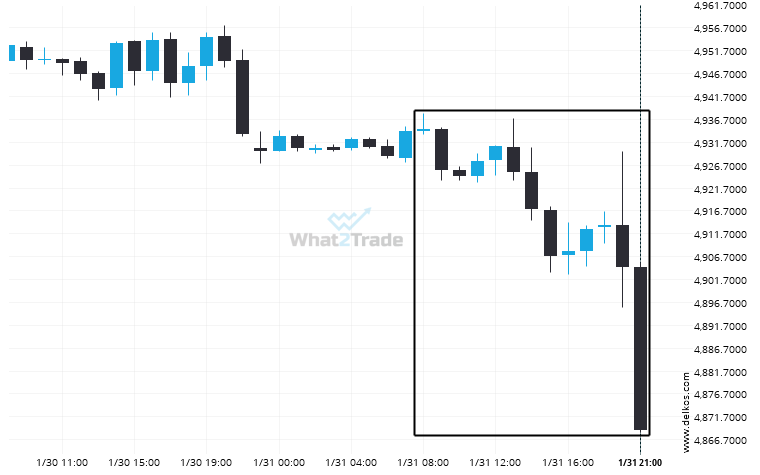
An unexpected large move has occurred on E-Mini S&P 500 March 2024 1 hour chart beginning at 4934.5 and ending at 4868.75. Is this a sign of something new? What can we expect in the future?
Related Posts
Silver Spot – approaching a price line that has been previously tested numerous times in the past
The movement of Silver Spot towards 33.4349 price line is yet another test of the line it reached…
Important resistance line being approached by Brent Crude. This price has been tested numerous time in the last 5 days
Brent Crude is trapped in a Rising Wedge formation, implying that a breakout is Imminent. This is a…
Is the extremely large movement on Brent Crude a sign of things to come?
Brent Crude hits 75.3935 after a 3.61% move spanning 2 days.