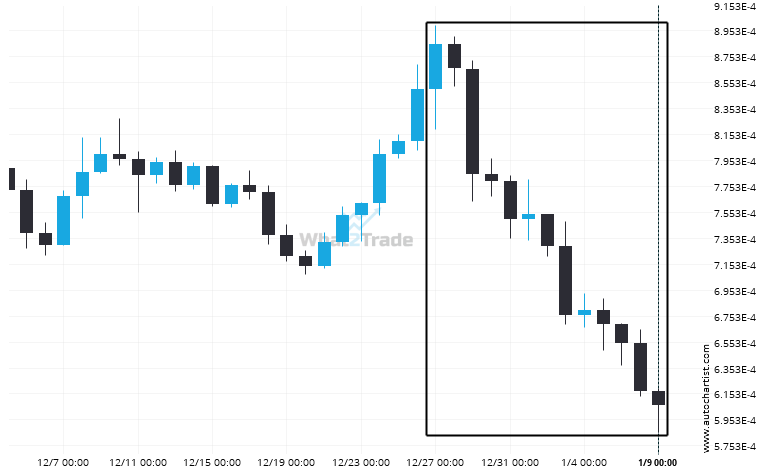
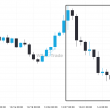
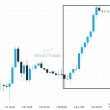
An unexpected large move has occurred on DASHBTC Daily chart beginning at 0.000885 and ending at 0.0006067. Is this a sign of something new? What can we expect in the future?
Related Posts
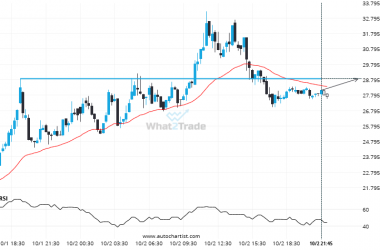
DASHEUR is quickly approaching a very important level it has previously tested numerous times in the past
The price of DASHEUR in heading back to the resistance area. It is possible that it will struggle…
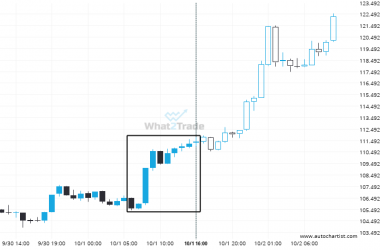
Extreme movement experienced on LTCUSD. Check the chart to see what to do next.
LTCUSD reached 111.36 after a 5.48% move spanning 10 hours.
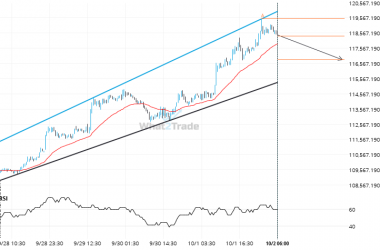
A Channel Up has formed, BTCUSD is approaching resistance. Can we expect a breakout and the start of a new trend or a reversal?
BTCUSD was identified at around 118356.65 having recently rebounded of the resistance on the 30 Minutes data interval.…

