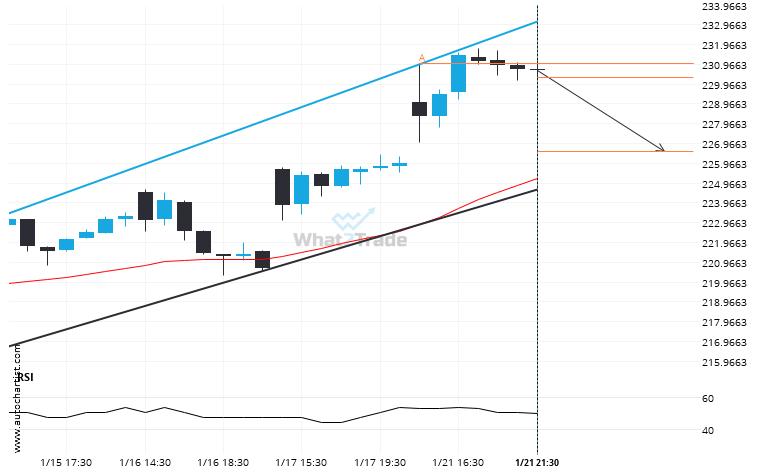
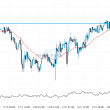
Emerging Channel Up pattern in its final wave was identified on the AMZN 1 hour chart. After a strong bearish run, we find AMZN heading towards the upper triangle line with a possible resistance at 226.5629. If the support shows to hold, the Channel Up pattern suggests a rebound back towards current levels.
Related Posts
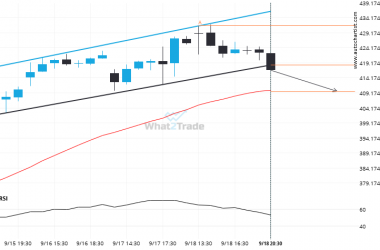
Interesting opportunity on TSLA after breaking 418.4015384615385
Flag pattern identified on TSLA has broken through a support level with the price momentum continuing to move…
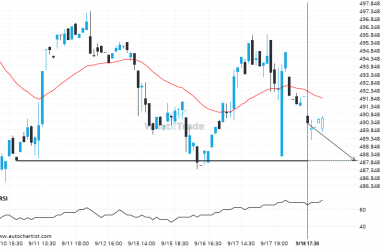
Will BRK.B break through the support level it tested before?
BRK.B is heading towards 487.9200 and could reach this point within the next 7 hours. It has tested…
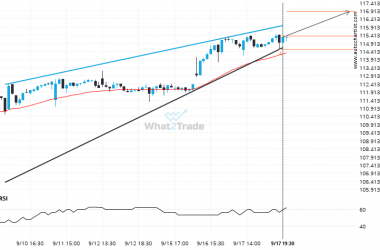
A possible move on XOM as it heads towards resistance
XOM is heading towards the resistance line of a Rising Wedge and could reach this point within the…

