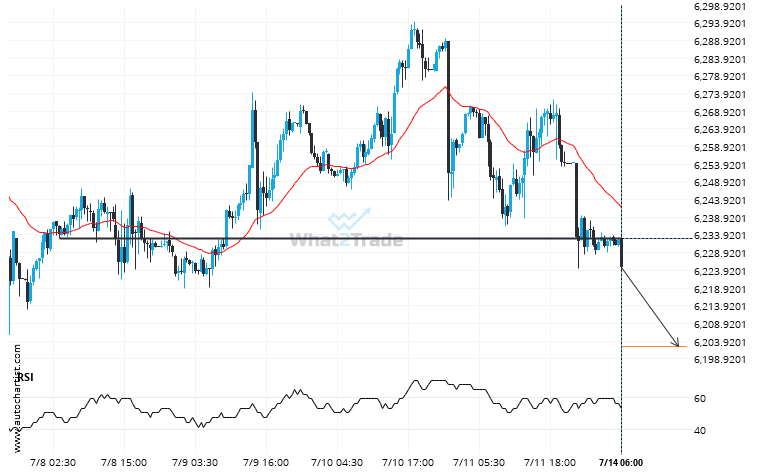
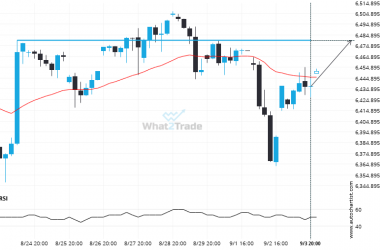
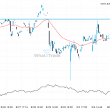
US 500 has broken through a line of 6232.8999. If this breakout holds true, we could see the price of US 500 heading towards 6202.3188 within the next 2 days. But don’t be so quick to trade, it has tested this line numerous times in the past, so you should probably confirm the breakout before placing any trades.
Related Posts
Nikkei 225 is signaling a possible trend reversal on the intraday charts with price not breaching support.
Nikkei 225 is approaching the resistance line of a Rising Wedge. It has touched this line numerous times…
Supports and resistances are primary concepts of technical analysis. DAX 40 is heading for an important price of 23798.8008 – read about what this could mean for the future.
A strong support level has been identified at 23798.8008 on the 30 Minutes DAX 40 chart. DAX 40…
Breach of resistance could mean a start of a bullish trend on CAC 40
Triangle pattern identified on CAC 40 has broken through a resistance level with the price momentum continuing to…