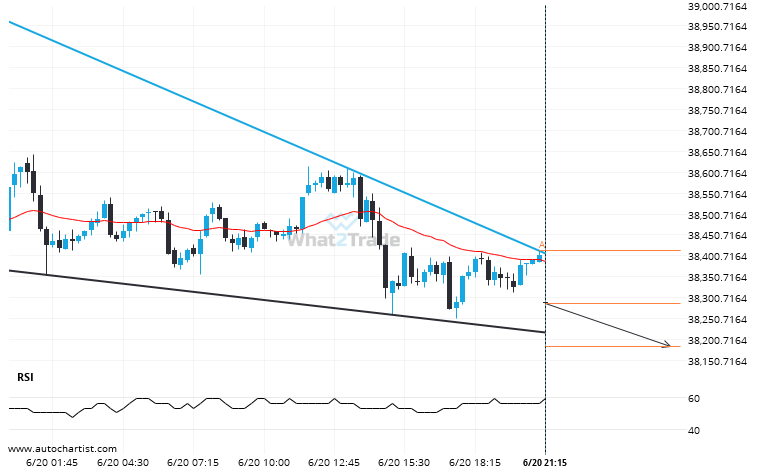
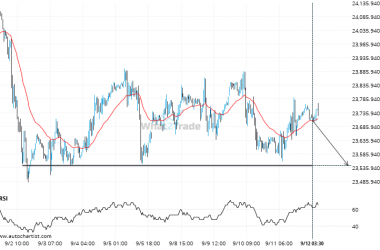
A Falling Wedge pattern was identified on Nikkei 225 at 38286.0, creating an expectation that it may move to the support line at 38183.4722. It may break through that line and continue the bearish trend or it may reverse from that line.
Related Posts
CAC 40 has formed 7 bearish candles successively, what is the probability of getting another bearish candle?
Rare set of consecutive candles on the CAC 40 4 hour chart. Could we expect a turn around…
After trying numerous times in the past, US 500 finally breaks 6232.8999!
US 500 has broken through a line of 6232.8999. If this breakout holds true, we could see the…
Because Nikkei 225 formed a Channel Down pattern, we expect it to touch the resistance line. If it breaks through resistance it may move much higher
A Channel Down pattern was identified on Nikkei 225 at 39504.0, creating an expectation that it may move…