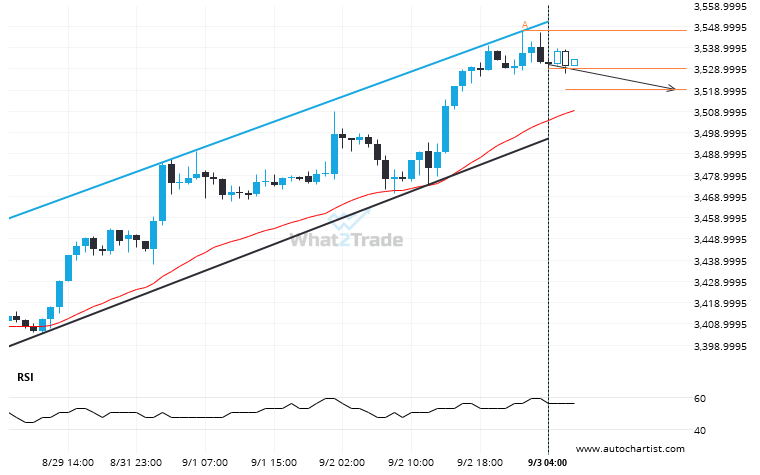
Gold Spot was identified at around 3529.325 having recently rebounded of the resistance on the 1 hour data interval. Ultimately, the price action of the stock has formed a Channel Up pattern. This squeeze may increases the chances of a strong breakout. The projected movement will potentially take the price to around the 3519.2064 level.
After testing the support line numerous times, Gold Spot is once again approaching this line. Can we expect a bearish trend to follow?