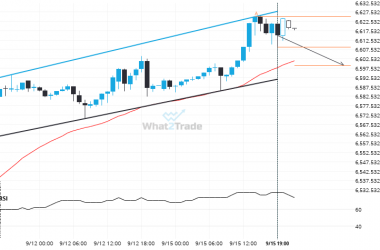
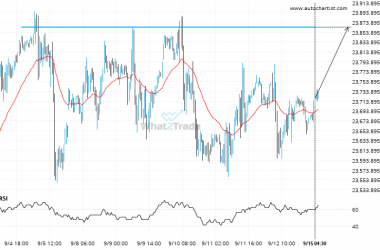
FTSE 100 was identified at around 8284.15 having recently rebounded of the resistance on the 4 hour data interval. Ultimately, the price action of the stock has formed a Head and Shoulders pattern. This squeeze may increases the chances of a strong breakout. The projected movement will potentially take the price to around the 8239.7382 level.
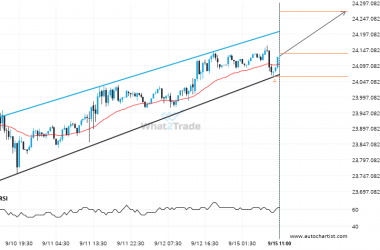
Related Posts
After trying numerous times in the past, FTSE 100 finally breaks 9165.2197!
FTSE 100 has breached the resistance line at 9165.2197. It may continue the bullish trend towards 9220.1670, or,…
Because DAX 40 formed a Inverse Head and Shoulders pattern, we expect it to touch the resistance line. If it breaks through resistance it may move much higher
DAX 40 is moving towards a resistance line which it has tested numerous times in the past. We…
After testing the resistance line numerous times, FTSE 100 is once again approaching this line. Can we expect a bullish trend to follow?
Emerging Rising Wedge detected on FTSE 100 – the pattern is an emerging one and has not yet…