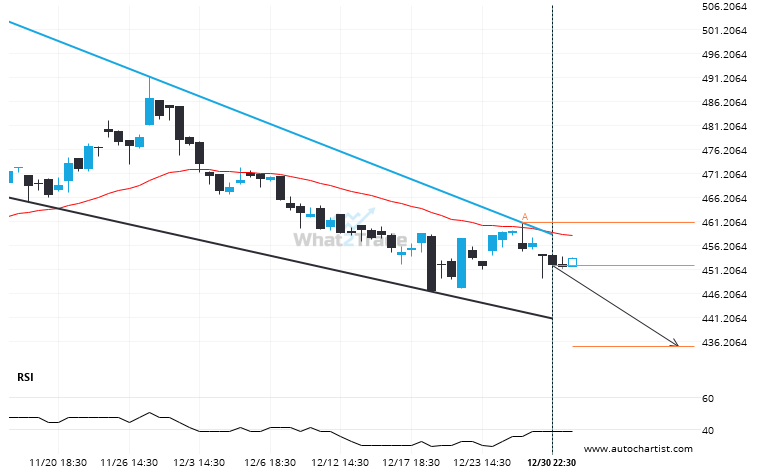
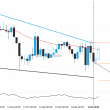
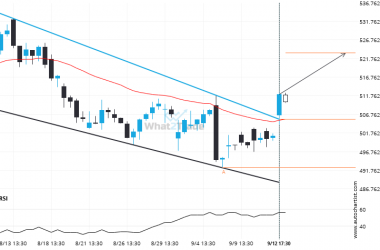
A Falling Wedge pattern was identified on BRK.B at 452.11, creating an expectation that it may move to the support line at 435.1491. It may break through that line and continue the bearish trend or it may reverse from that line.
Related Posts
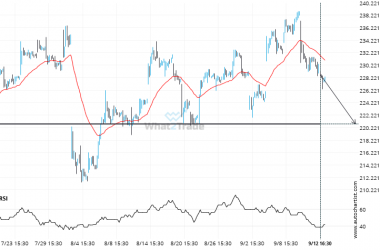
AMZN seems to be on its way to support – a possible opportunity?
AMZN is moving towards a support line. Because we have seen it retrace from this level in the…
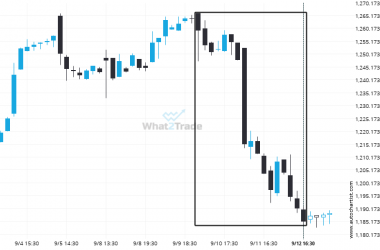
NFLX reached 1185.06 after a 5.9% move spanning 3 days.
NFLX has moved lower by 5.9% from 1259.325 to 1185.06 in the last 3 days.
Resistance line breached by MSFT. This price has been tested at least twice before.
MSFT has broken through a resistance line of a Channel Down chart pattern. If this breakout holds true,…

