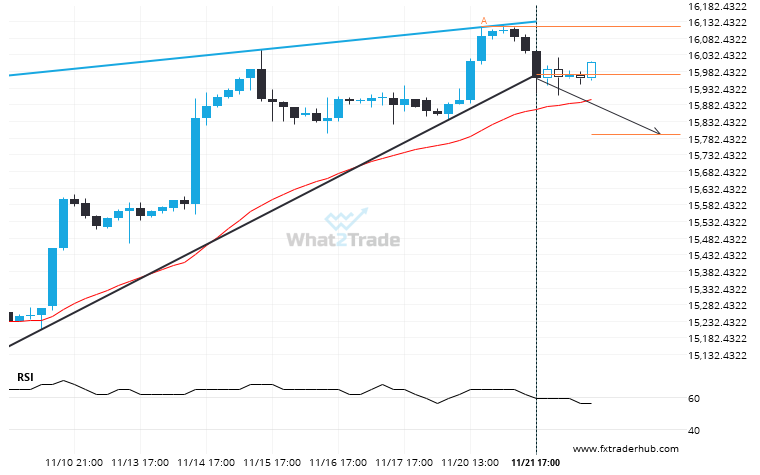
NAS100 moved through the support line of a Rising Wedge at 15973.466216216217 on the 4 hour chart. This line has been tested a number of times in the past and this breakout could mean an upcoming change from the current trend. It may continue in its current direction toward 15793.7734.
After testing support twice in the past, NAS100 has finally broken through. Can we expect a bearish trend to follow?