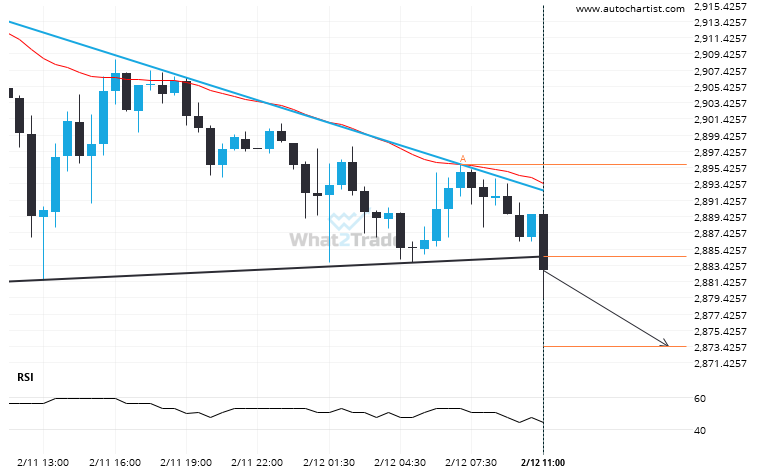
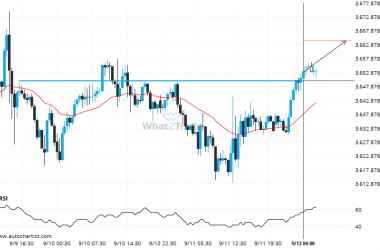
Gold Spot has broken through a support line of a Triangle chart pattern. If this breakout holds true, we may see the price of Gold Spot testing 2873.4245 within the next 6 hours. But don’t be so quick to trade, it has tested this line in the past, so you should confirm the breakout before taking any action.
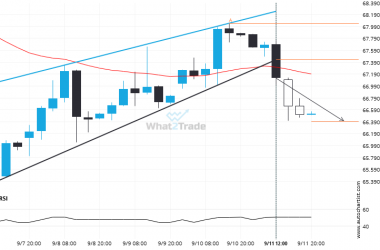
Related Posts
Supports and resistances are primary concepts of technical analysis. Brent Crude is heading for an important price of 64.8040 – read about what this could mean for the future.
Brent Crude is en route to a very important line that will be a definite deciding factor of…
Because Silver Spot formed a Channel Down pattern, we expect it to touch the support line. If it breaks through support it may move much lower
Silver Spot is trapped in a Channel Down formation, implying that a breakout is Imminent. This is a…
Gold Spot is quickly approaching the support line of a Flag. We expect either a breakout through this line or a rebound.
A Flag pattern was identified on Gold Spot at 3174.8255, creating an expectation that it may move to…