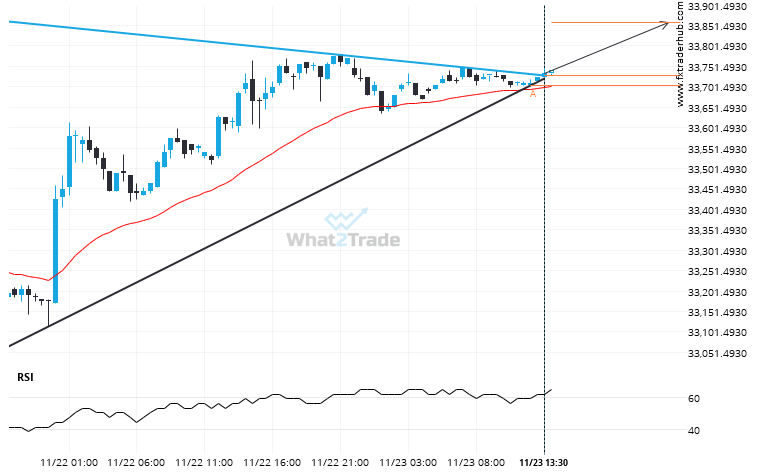
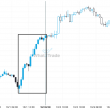
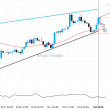
JPN225 has broken through a resistance line of a Triangle chart pattern. If this breakout holds true, we may see the price of JPN225 testing 33859.1398 within the next 12 hours. But don’t be so quick to trade, it has tested this line in the past, so you should confirm the breakout before taking any action.
Related Posts
Supports and resistances are primary concepts of technical analysis. FTSE 100 is heading for an important price of 8805.9805 – read about what this could mean for the future.
The price of FTSE 100 in heading back to the support area. It is possible that it will…
US 500 is quickly approaching the support line of a Descending Triangle. We expect either a breakout through this line or a rebound.
US 500 is moving towards a support line which it has tested numerous times in the past. We…
CAC 40 is approaching a resistance line of a Channel Down. It has touched this line numerous times in the last 25 days.
CAC 40 is moving towards a resistance line. Because we have seen it retrace from this line before,…