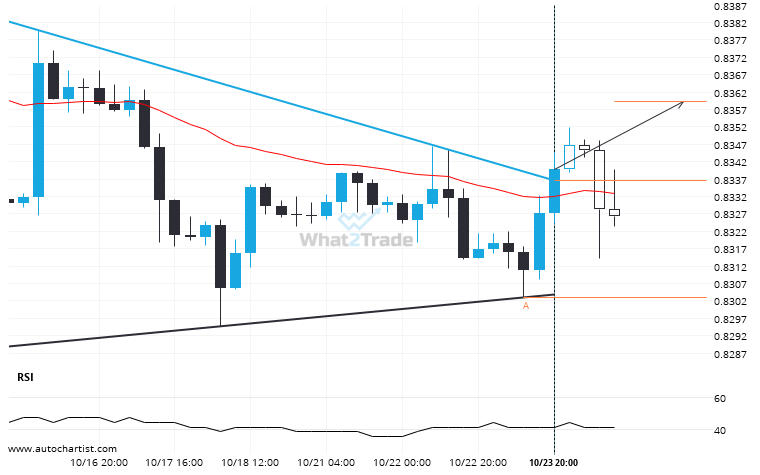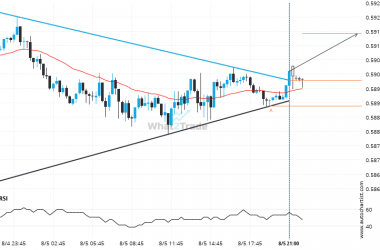
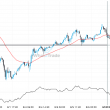
EURGBP moved through the resistance line of a Triangle at 0.8337007407407407 on the 4 hour chart. This line has been tested a number of times in the past and this breakout could mean an upcoming change from the current trend. It may continue in its current direction toward 0.8360.
After testing resistance twice in the past, EURGBP has finally broken through. Can we expect a bullish trend to follow?