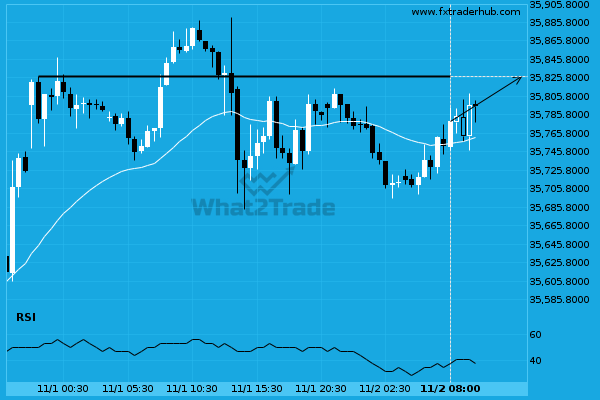
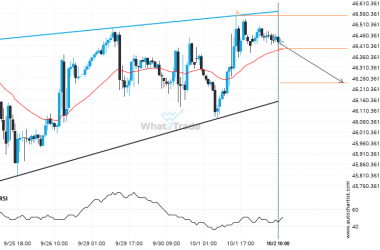
The movement of US30 towards 35827.0000 price line is yet another test of the line it reached numerous times in the past. We could expect this test to happen in the next 6 hours, but it is uncertain whether it will result in a breakout through this line, or simply rebound back to current lines.
Related Posts
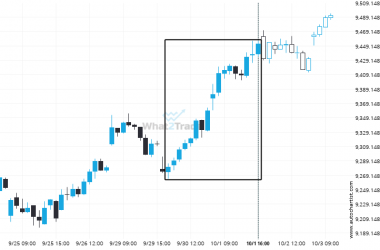
FTSE 100 reached 9451.85 after a 1.84% move spanning 2 days.
FTSE 100 recorded a considerable move in the last day — one of its biggest in recent sessions.
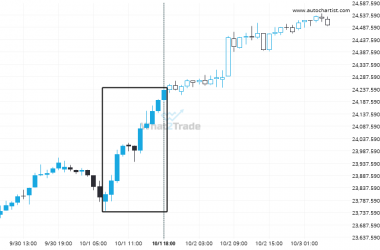
Big bullish swing on DAX 40 – this may be one of its more notable movements in the recent session.
DAX 40 reached 24232.6 after a 1.77% move spanning 11 hours.
DOW 30 is signaling a possible trend reversal on the intraday charts with price not breaching resistance.
DOW 30 was identified at around 46395.84 having recently rebounded of the resistance on the 1 hour data…


