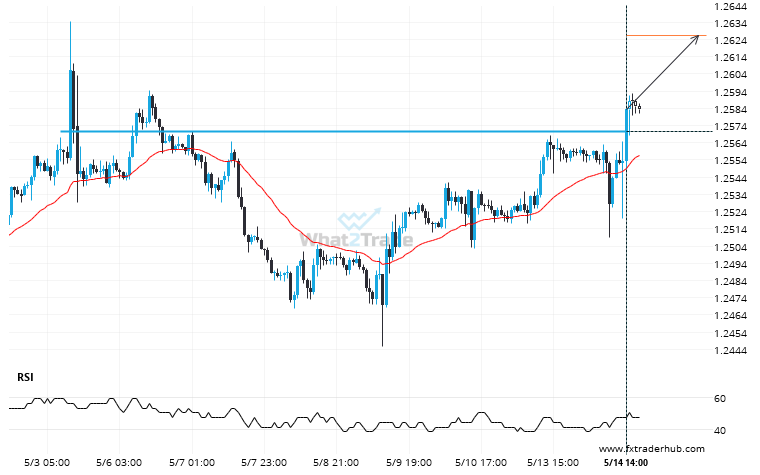
GBP/USD is once again retesting a key horizontal resistance level at 1.2571. It has tested this level 4 times in the recent past and could simply bounce off like it did last time. However, after this many tries, maybe it’s ready to start a new trend.
Related Posts
GBPJPY moves lower to 193.0935 in the last 6 days.
GBPJPY has experienced an exceptionally large amount of consecutive bearish candles to reach a price of 193.0935 in…
GBPUSD heading towards a price it has tested 5 times in the recent past.
GBPUSD is heading towards 1.3568 and could reach this point within the next 2 days. It has tested…
After testing the support line numerous times, GBPCHF is once again approaching this line. Can we expect a bearish trend to follow?
Emerging Falling Wedge pattern in its final wave was identified on the GBPCHF 1 hour chart. After a…