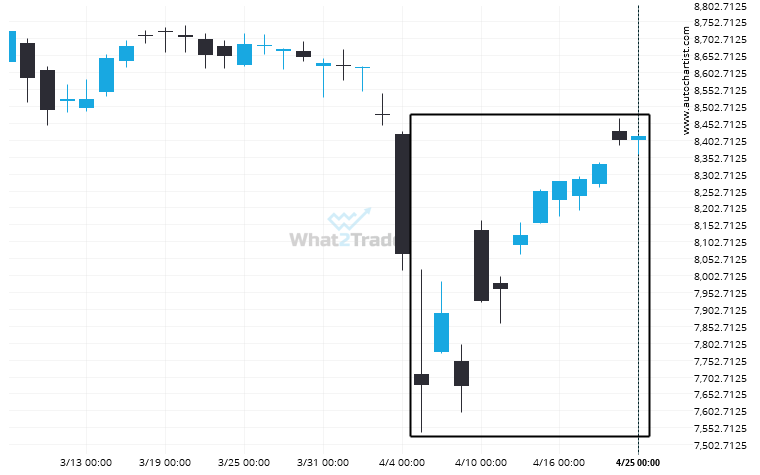
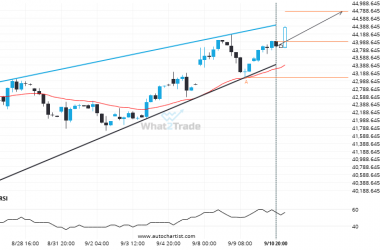
An unexpected large move has occurred on FTSE 100 Daily chart beginning at 7677.0 and ending at 8413.9. Is this a sign of something new? What can we expect in the future?
Related Posts
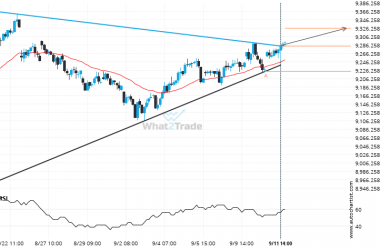
FTSE 100 breakout from a Triangle trade setup. Will it continue this trend to hit the target price?
This trade setup on FTSE 100 is formed by a period of consolidation; a period in which the…
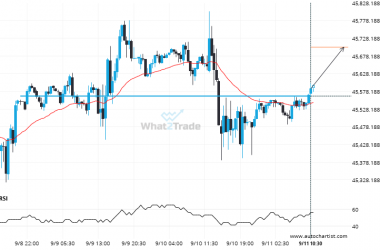
Big movement possible on DOW 30 after a breach of 45564.9883
The price of DOW 30 in heading in the direction of 45702.3633. Despite the recent breakout through 45564.9883…
Nikkei 225 is signaling a possible trend reversal on the intraday charts with price not breaching support.
Nikkei 225 was identified at around 43994.0 having recently rebounded of the support on the 4 hour data…

