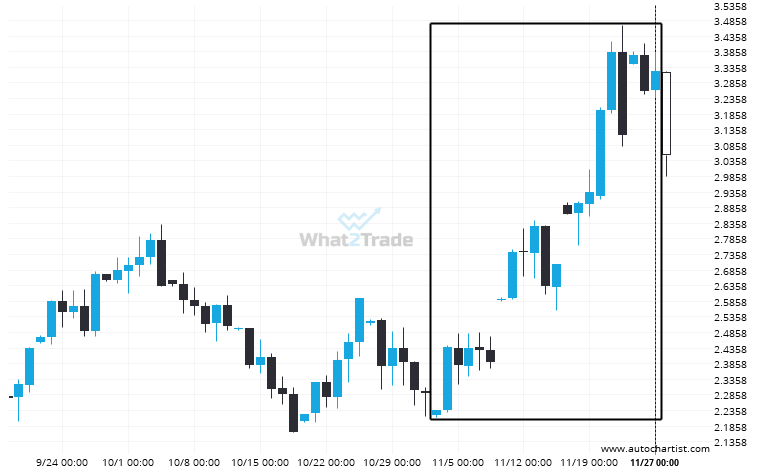
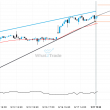
An unexpected large move has occurred on Natural Gas Daily chart beginning at 2.2355 and ending at 3.3215. Is this a sign of something new? What can we expect in the future?
Related Posts
Natural Gas is quickly approaching the resistance line of a Falling Wedge. We expect either a breakout through this line or a rebound.
Natural Gas is moving towards a resistance line which it has tested numerous times in the past. We…
Brent Crude – breach of a trending resistance line that has been tested at least twice before.
Brent Crude has broken through a resistance line of a Triangle and suggests a possible movement to 74.1699…
Important price line being approached by Brent Crude. This price has been tested numerous times before.
Brent Crude is moving towards a key resistance level at 73.6755. This is a previously tested level for…