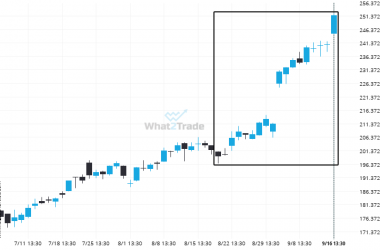
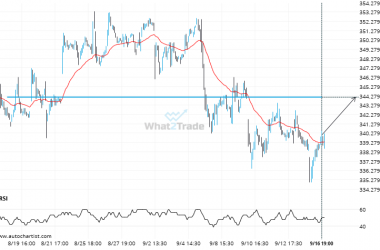
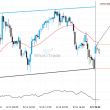
XOM is moving towards a resistance line. Because we have seen it retrace from this line before, we could see either a break through this line, or a rebound back to current levels. It has touched this line numerous times in the last 8 days and may test it again within the next 10 hours.
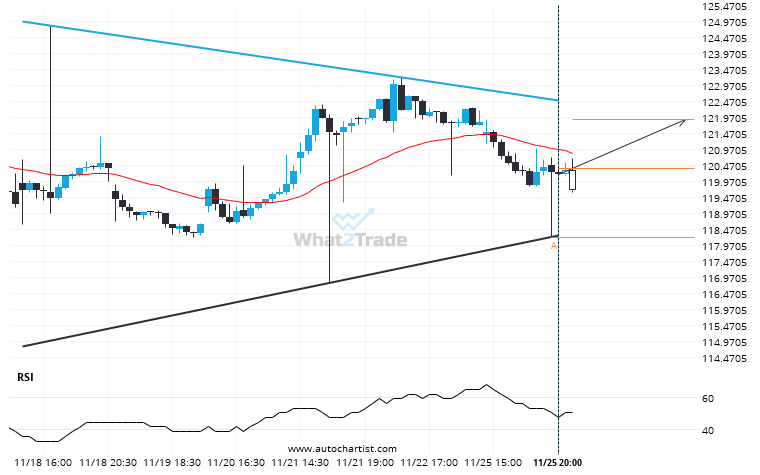
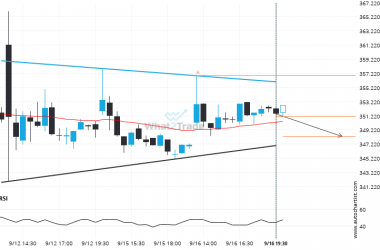
Related Posts
An unexpected large move occurred on GOOGL Daily chart. The shift stands out in recent activity.
GOOGL just posted a 26.23% move over the past 28 days – a move that won’t go unnoticed…
If you’re short V you should be aware of the rapidly approaching level of 344.1500
V is heading towards a line of 344.1500. If this movement continues, the price of V could test…
ADBE is approaching a support line of a Triangle. It has touched this line numerous times in the last 6 days.
An emerging Triangle has been detected on ADBE on the 30 Minutes chart. There is a possible move…