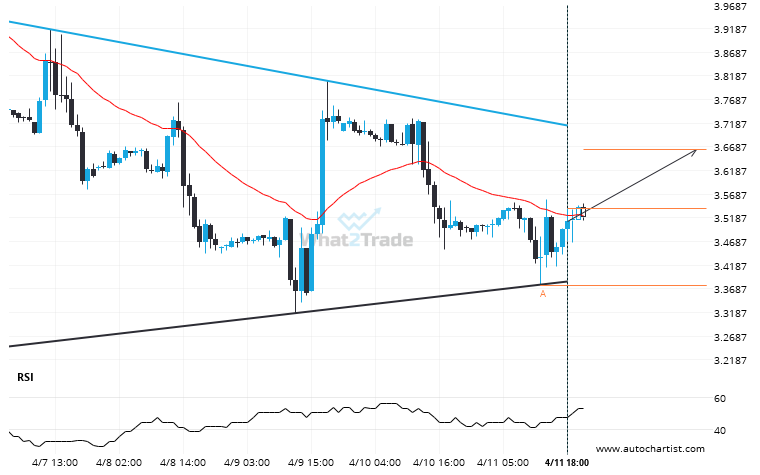
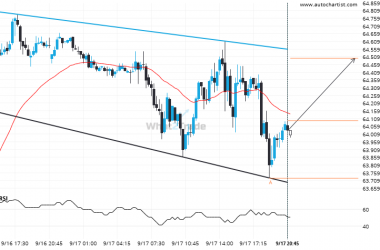
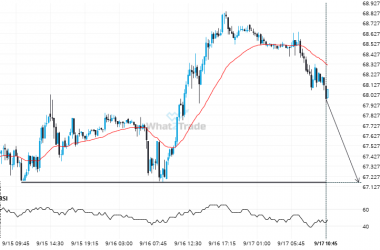
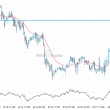
Emerging Triangle detected on Natural Gas – the pattern is an emerging one and has not yet broken through support, but the price is expected to move up over the next few hours. The price at the time the pattern was found was 3.5385 and it is expected to move to 3.6633.
Related Posts
A possible move on Natural Gas as it heads towards support
Natural Gas was identified at around 3.2975 having recently rebounded of the resistance on the 4 hour data…
Supports and resistances are primary concepts of technical analysis. US Oil is heading for an important price of 62.3310 – read about what this could mean for the future.
US Oil is about to retest a key horizontal resistance level near 62.3310. It has tested this level…
US Oil formed a Channel Up on the 30 Minutes chart. Retest of resistance in sight.
US Oil is moving towards a resistance line. Because we have seen it retrace from this line before,…