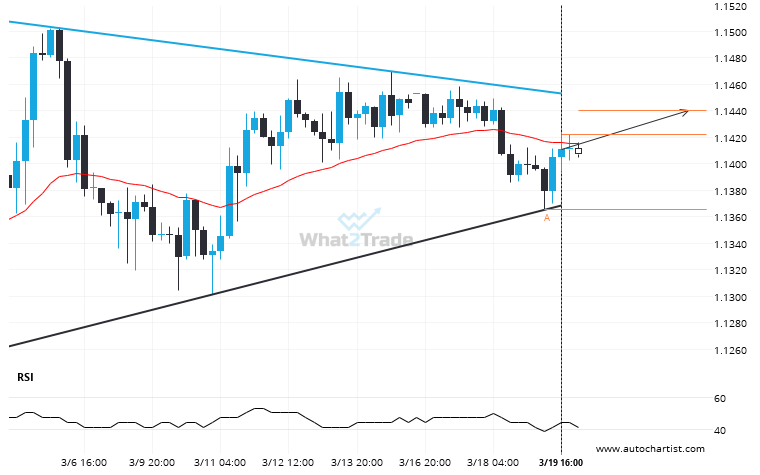
A Triangle pattern was identified on GBPCHF at 1.142265, creating an expectation that it may move to the resistance line at 1.1440. It may break through that line and continue the bullish trend or it may reverse from that line.
Related Posts
USDCHF formed a Channel Down on the 4 hour chart. Retest of resistance in sight.
A Channel Down pattern was identified on USDCHF at 0.78923, creating an expectation that it may move to…
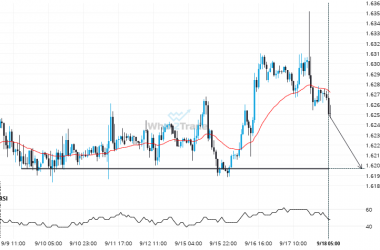
EURCAD likely to test 1.6205 in the near future. Where to next?
EURCAD is approaching a support line at 1.6205. If it hits the support line, it may break through…
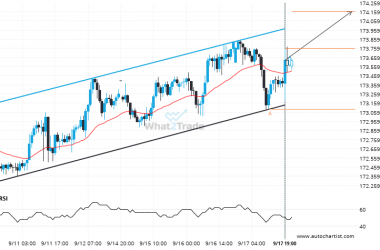
EURJPY is approaching a resistance line of a Channel Up. It has touched this line numerous times in the last 8 days.
Emerging Channel Up pattern in its final wave was identified on the EURJPY 1 hour chart. After a…

