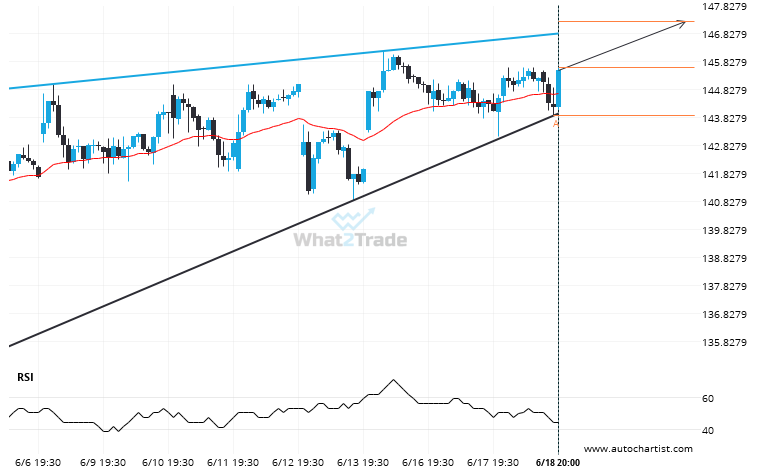
A Rising Wedge pattern was identified on NVDA at 145.61, creating an expectation that it may move to the resistance line at 147.2476. It may break through that line and continue the bullish trend or it may reverse from that line.
Related Posts
If AAPL touches 211.8250 it may be time to take action.
The movement of AAPL towards 211.8250 price line is yet another test of the line it reached numerous…
XOM is signaling a possible trend reversal on the intraday charts with price not breaching support.
XOM was identified at around 115.01 having recently rebounded of the support on the 15 Minutes data interval.…
BRK.B may be on a start of a new bearish trend after its breakout through this important support level
BRK.B has broken through a line of 481.9500. If this breakout holds true, we could see the price…