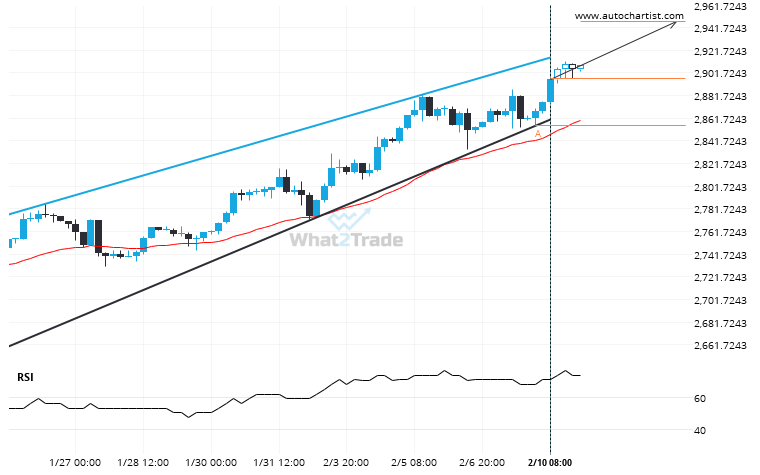
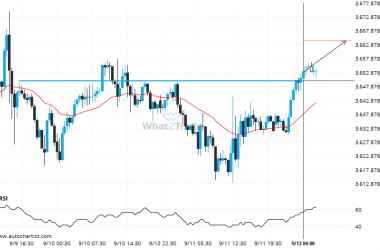
Gold Spot was identified at around 2896.65 having recently rebounded of the support on the 4 hour data interval. Ultimately, the price action of the stock has formed a Rising Wedge pattern. This squeeze may increases the chances of a strong breakout. The projected movement will potentially take the price to around the 2947.3525 level.
A Rising Wedge has formed, Gold Spot is approaching support. Can we expect a breakout and the start of a new trend or a reversal?