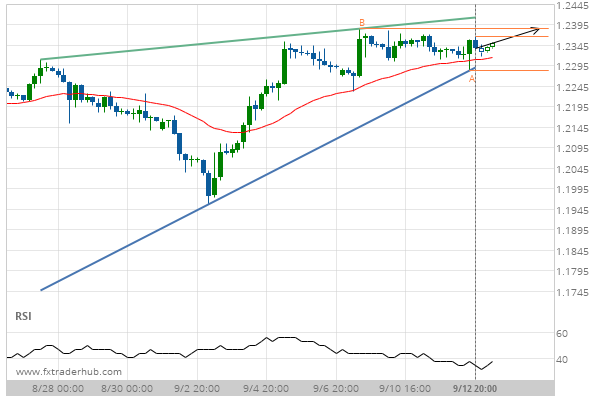
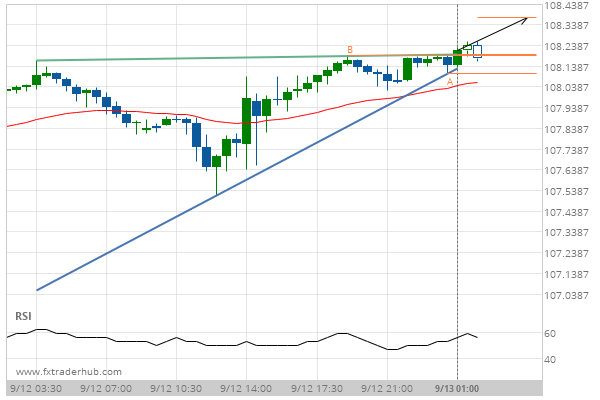
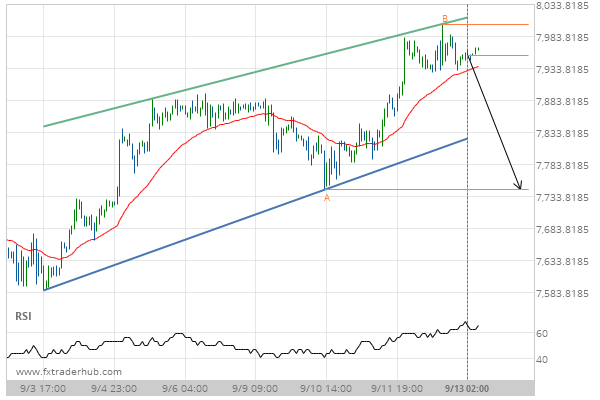
GBP/USD is heading towards the resistance line of a Rising Wedge and could reach this point within the next 4 days. It has tested this line numerous times in the past, and this time could be no different from the past, ending in a rebound instead of a breakout. If the breakout doesn’t happen, we could see a retracement back down to current levels.
Related Posts
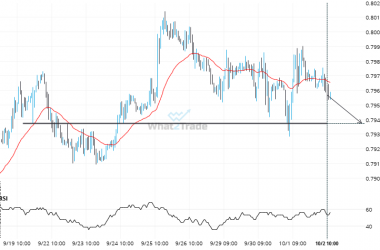
If you’re long USDCHF you should be aware of the rapidly approaching level of 0.7937
USDCHF is about to retest a key horizontal support level near 0.7937. It has tested this level 5…
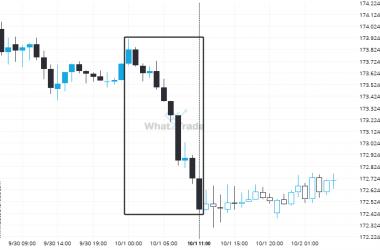
EURJPY – Large moves like this tend to draw attention.
EURJPY reached 172.4555 after a 0.79% move spanning 11 hours.
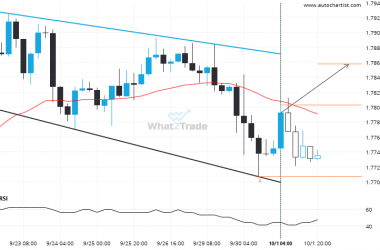
EURAUD is quickly approaching the resistance line of a Channel Down. We expect either a breakout through this line or a rebound.
EURAUD was identified at around 1.780935 having recently rebounded of the support on the 4 hour data interval.…

