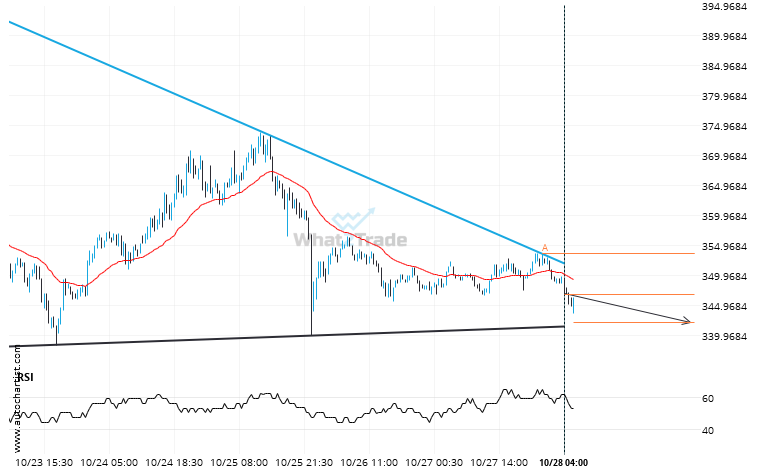
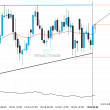
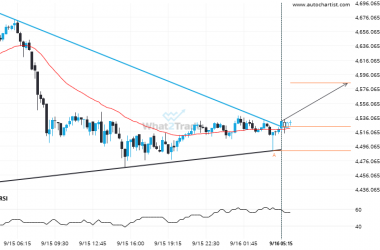
An emerging Descending Triangle has been detected on BCHUSD on the 30 Minutes chart. There is a possible move towards 342.1972 next few candles. Once reaching resistance it may continue its bearish run or reverse back to current price levels.
Related Posts
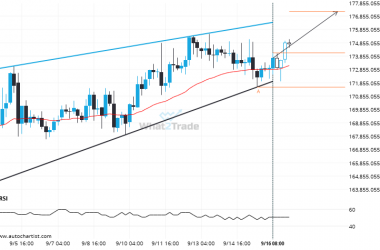
BTCAUD is approaching a resistance line of a Rising Wedge. It has touched this line numerous times in the last 15 days.
BTCAUD is moving towards a resistance line. Because we have seen it retrace from this line before, we…
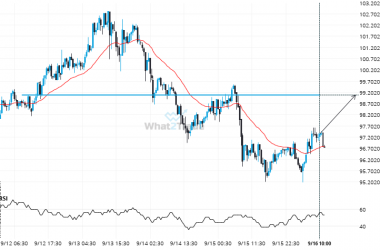
Supports and resistances are primary concepts of technical analysis. LTCEUR is heading for an important price of 99.0900 – read about what this could mean for the future.
The movement of LTCEUR towards 99.0900 price line is yet another test of the line it reached numerous…
ETHUSD has broken out from the Triangle pattern. Expect it to hit 4584.1456 soon.
The breakout of ETHUSD through the resistance line of a Triangle could be a sign of the road…

