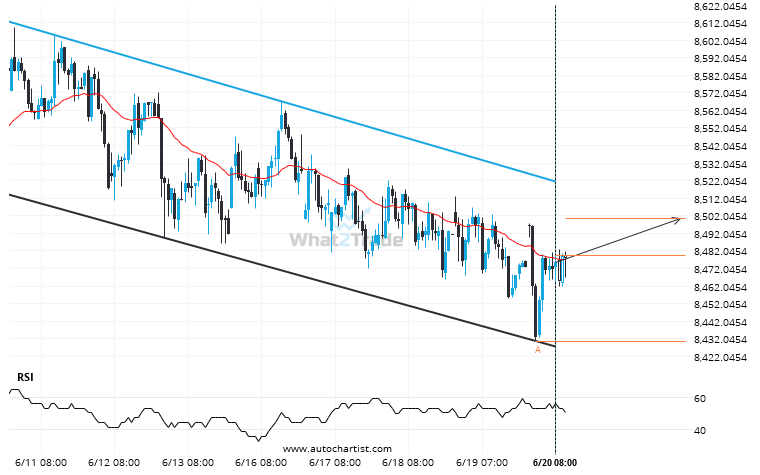
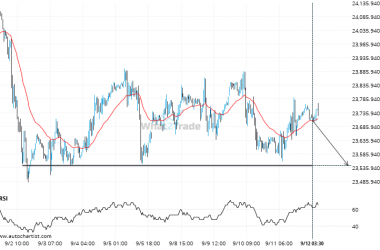
Emerging Channel Down pattern in its final wave was identified on the ASX 200 1 hour chart. After a strong bullish run, we find ASX 200 heading towards the upper triangle line with a possible resistance at 8500.7721. If the resistance shows to hold, the Channel Down pattern suggests a rebound back towards current levels.
Related Posts
After trying numerous times in the past, DOW 30 finally breaks 44374.6914!
DOW 30 is once again retesting a key horizontal support level at 44374.6914. It has tested this level…
After testing 44227.1914 numerous times, DOW 30 is once again approaching this price point. Can we expect a bearish trend to follow?
The movement of DOW 30 towards 44227.1914 price line is yet another test of the line it reached…
Nikkei 225 formed a Channel Down on the 4 hour chart. Retest of support in sight.
An emerging Channel Down has been detected on Nikkei 225 on the 4 hour chart. There is a…