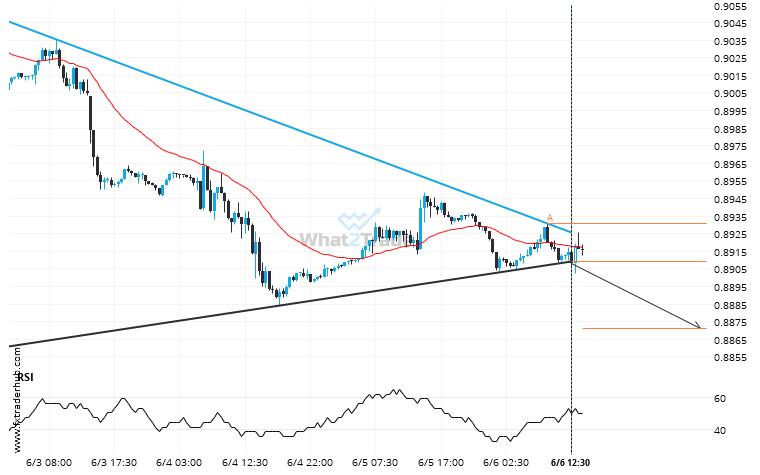
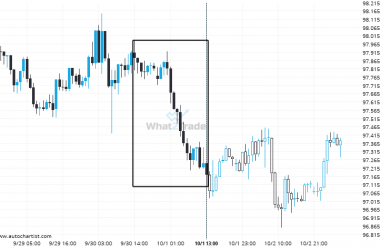
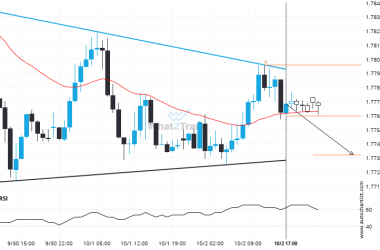
USD/CHF moved through the support line of a Triangle at 0.8909753623188404 on the 30 Minutes chart. This line has been tested a number of times in the past and this breakout could mean an upcoming change from the current trend. It may continue in its current direction toward 0.8872.
Related Posts
After testing resistance twice in the past, GBP/USD has finally broken through. Can we expect a bullish trend to follow?
You would be well advised to confirm the breakout that has just occurred – do you believe the…
We expect AUDUSD to trend downwards for the next 48 hours.
We expect AUDUSD to trend downwards for the next 48 hours. Based on these past Japan Consumer Confidence…
EUR/USD – breach of a trending resistance line that has been tested at least twice before.
This trade setup on EUR/USD is formed by a period of consolidation; a period in which the price…