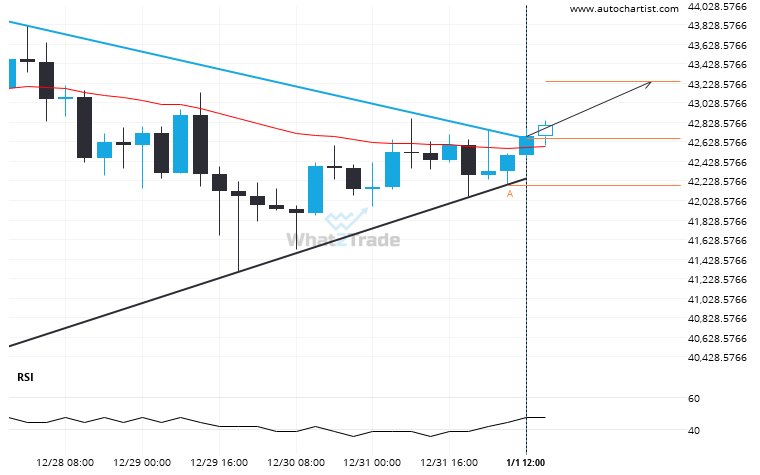
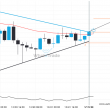
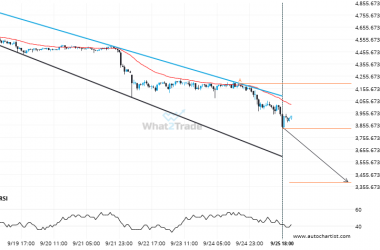
BTCUSD has broken through a resistance line of a Triangle chart pattern. If this breakout holds true, we may see the price of BTCUSD testing 43246.9206 within the next 2 days. But don’t be so quick to trade, it has tested this line in the past, so you should confirm the breakout before taking any action.
Related Posts
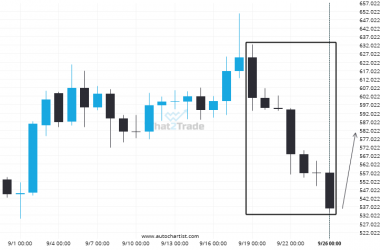
BCHUSD recorded 7 consecutive daily bearish candles reaching 536.0100.
BCHUSD experienced a high number of bearish candles reaching 536.0100 over 8 days.
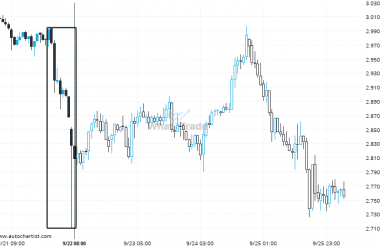
XRPUSD reached 2.808 after a 6.15% move spanning 10 hours.
XRPUSD recorded a considerable move in the last 10 hours — one of its biggest in recent sessions.
ETHUSD is quickly approaching the support line of a Channel Down. We expect either a breakout through this line or a rebound.
ETHUSD is moving towards a support line. Because we have seen it retrace from this line before, we…

