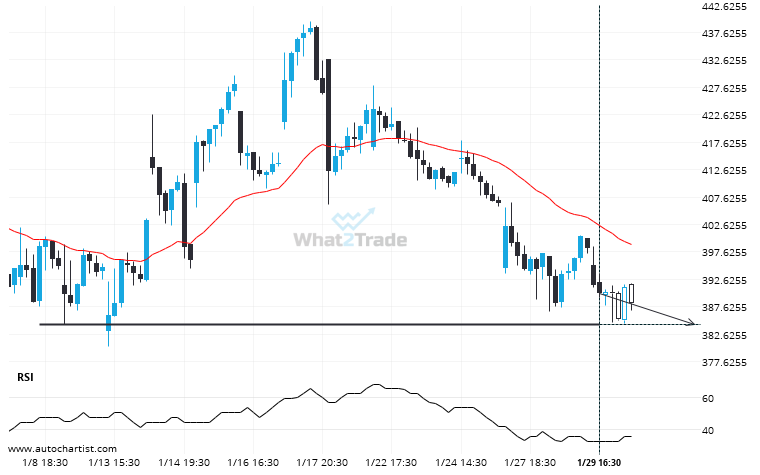
TSLA is about to retest a key horizontal support level near 384.3300. It has tested this level 3 times in the recent past and could simply bounce off like it did last time. However, after this many tries, maybe it’s ready to start a new trend.
Related Posts
After experiencing 4 consecutive 4 hour bearish candles in the space of 5 days, nobody knows where INTC is headed.
Due to the rate of consecutive bearish candles on INTC 4 hour chart we could be in for…
BIDU has broken through a support line. It has touched this line numerous times in the last 22 days.
The breakout of BIDU through the 89.5800 price line is a breach of an important psychological price that…
A Channel Up has formed, NVDA is approaching support. Can we expect a breakout and the start of a new trend or a reversal?
Emerging Channel Up detected on NVDA – the pattern is an emerging one and has not yet broken…