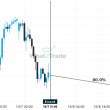
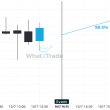
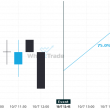
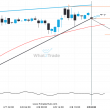
A strong resistance level has been identified at 2059.6001 on the 1 hour Gold April 2024 chart. Gold April 2024 is likely to test it soon.
Related Posts
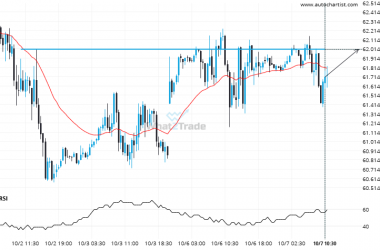
Will US Oil break through the resistance level it tested before?
US Oil is moving towards a key resistance level at 62.0110. This is a previously tested level for…
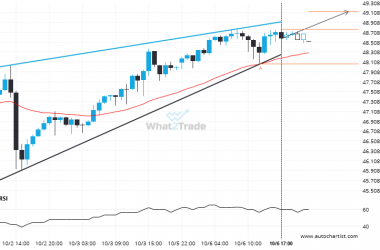
Silver Spot is signaling a possible trend reversal on the intraday charts with price not breaching support.
Silver Spot was identified at around 48.76785 having recently rebounded of the support on the 1 hour data…
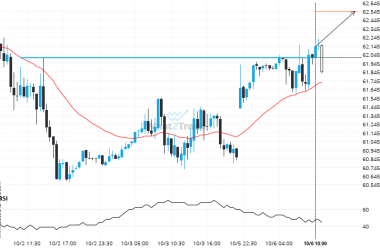
Important price line breached by US Oil. This price has been tested numerous times before.
US Oil has broken through a resistance line. Because we have seen it retrace from this price in…

