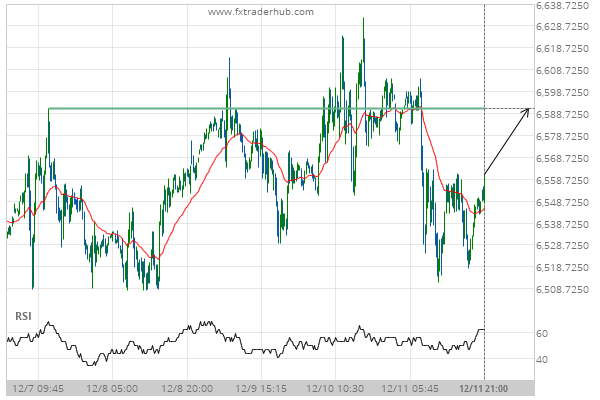
UK100 is heading towards a price line of 6591.0000 and could reach this point within the next 22 hours. It has tested this line numerous times in the past, and this time could be no different from the past, ending in a rebound instead of a breakout. If the breakout doesn’t happen, we could see a retracement back down to current lines.
Related Posts
Rare bullish streak on the NAS 100 4 hour chart.
Rare candle sequence recorded on the NAS 100 4 hour chart, ending at 24497.3588.
If you’re short ASX 200 you should be aware of the rapidly approaching level of 8805.2998
ASX 200 is heading towards a line of 8805.2998. If this movement continues, the price of ASX 200…
FTSE 100 is quickly approaching the support line of a Channel Down. We expect either a breakout through this line or a rebound.
Emerging Channel Down pattern in its final wave was identified on the FTSE 100 4 hour chart. After…