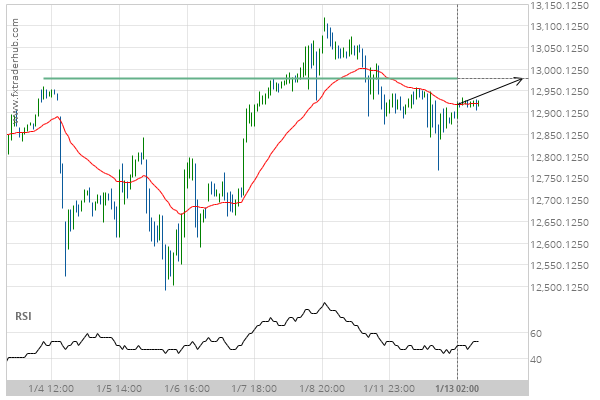
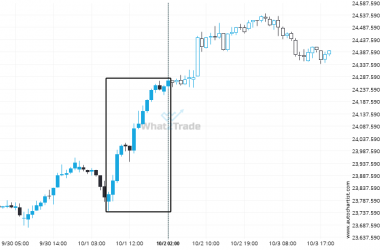
NAS100 is heading towards a price line of 12978.2500 and could reach this point within the next 2 days. It has tested this line numerous times in the past, and this time could be no different from the past, ending in a rebound instead of a breakout. If the breakout doesn’t happen, we could see a retracement back down to current lines.
Related Posts
After experiencing a 2.39% bullish move in the space of 6 days, nobody knows where FTSE 100 is headed.
Those of you that are trend followers are probably eagerly watching FTSE 100 to see if its latest…
US 500 is approaching 6096.7402. We expect either a breakout through this line, or a rebound.
US 500 is moving towards a resistance line. Because we have seen it retrace from this level in…
US 500 formed a Descending Triangle on the 4 hour chart. Retest of support in sight.
Emerging Descending Triangle detected on US 500 – the pattern is an emerging one and has not yet…