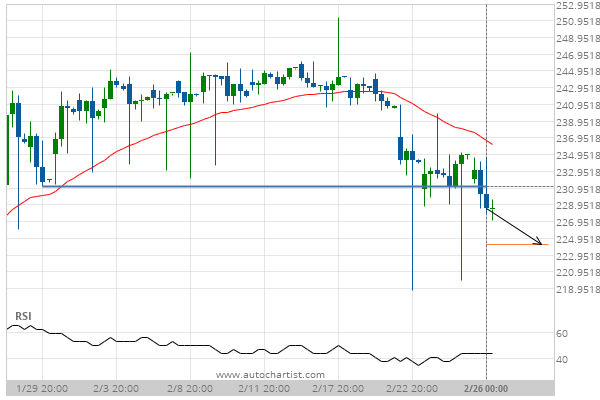
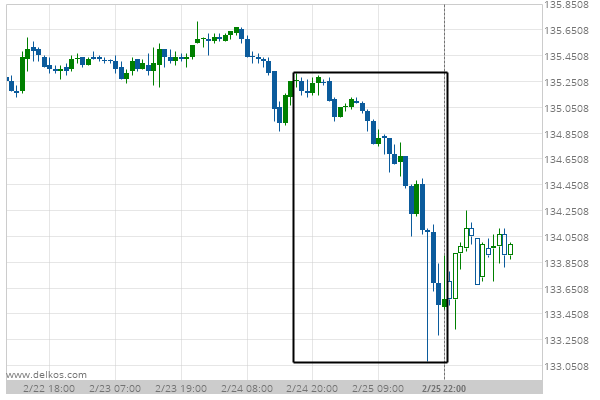
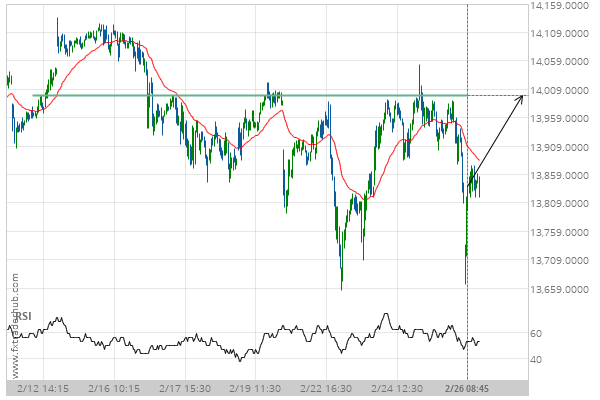
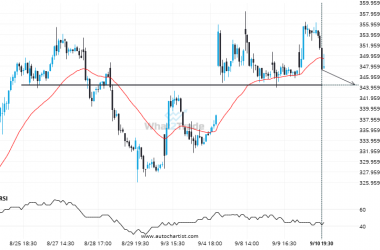
Microsoft Corporation has broken through a line of 231.09 which it has tested numerous times in the past. We have seen it retrace from this position in the past, one should wait for confirmation of the breakout before trading. If this new trend persists, a target line of around 224.25 can be expected within the next 3 days.
Related Posts
GOOGL formed a Channel Up on the 1 hour chart. Retest of resistance in sight.
GOOGL is heading towards the resistance line of a Channel Up and could reach this point within the…
PYPL moves lower to 65.6650 in the last 2 days.
Rare candle sequence recorded on the PYPL 4 hour chart, ending at 65.6650.
TSLA heading towards a price it has tested 5 times in the recent past.
The movement of TSLA towards 344.4200 price line is yet another test of the line it reached numerous…

