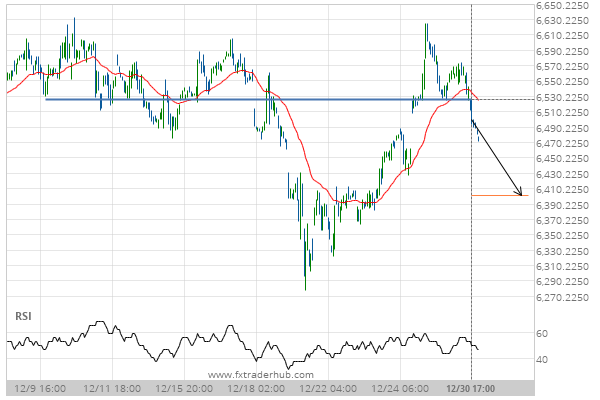
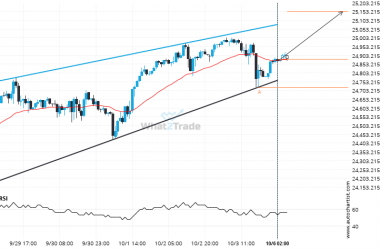
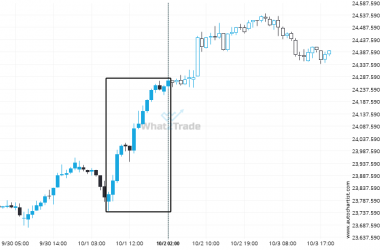
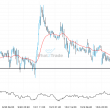
UK100 has broken through a line of 6525.5000 which it has tested numerous times in the past. We have seen it retrace from this position in the past, one should wait for confirmation of the breakout before trading. If this new trend persists, a target line of around 6401.4502 can be expected within the next 3 days.
Related Posts
ASX 200 formed a Channel Up on the 1 hour chart. Retest of support in sight.
ASX 200 was identified at around 8577.7 having recently rebounded of the resistance on the 1 hour data…
CAC 40 has formed 7 bearish candles successively, what is the probability of getting another bearish candle?
Rare set of consecutive candles on the CAC 40 4 hour chart. Could we expect a turn around…
After trying numerous times in the past, US 500 finally breaks 6232.8999!
US 500 has broken through a line of 6232.8999. If this breakout holds true, we could see the…