In order to be successful, forex traders need to know the basic mathematics of probability. After all, it’s difficult to achieve and maintain trading gains without first having the ability to understand the numbers and measure them.
Many traders use a combination of black box indicators to develop and implement trading rules. Yet, the difference between a “good” trader and a great one is his or her understanding of the metrics and methods for calculating performance and gains.
Probability and statistics are the key to developing, testing and profiting from forex trading. By knowing a few probability tools, it’s easier for traders to set trading goals in mathematical terms, create and operate effective trading strategies, and assess results.
It’s helpful to review the most basic concepts of probability and statistics for forex trading. By understanding the math of probability, you’ll know the logic used by mechanical trading systems and expert advisors (EA).
Normal distribution
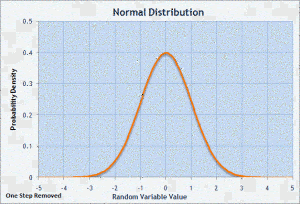
The most basic tool of probability in forex trading is the concept of normal distribution. Most natural processes are said to be “normally distributed.”
“Uniform distribution” implies that the probability of a number being anywhere on a continuum is about equal. This is the sort of distribution that would result from artificially spreading objects as evenly as possible across an area, with a uniform amount of spacing between them.
However, instead of a uniform distribution, a currency-pair’s price will likely be found within a certain area at any given time. This is its “normal distribution,” and probability tools can show an approximation of where that price is likely to be found.
Normal distribution offers forex traders predictive power regarding the likelihood that a currency-pair price will reach a certain level during a certain time frame.
Computers use a random-number generator to calculate the means (averages) of forex prices in order to determine their normal distribution.
If a large number of sample prices are checked, the normal distribution will form the shape of a bell curve when plotted graphically. The greater the number of samples, the smoother the curve will be.
The rules of simple averages are helpful to traders, yet the rules of normal distribution offer more useful predictive power. For example, a trader may calculate that the “average” daily price move of a forex pair is, say, 50 pips.
Yet, the normal distribution can also tell the trader the likelihood that a certain daily price move will fall between 30 and 50 pips, or between 50 and 70 pips.
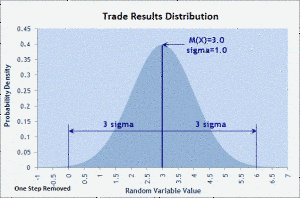
According to the rules of normal distribution and standard deviation, approximately 68% of the samples will be found within one standard deviation of the mean (average), and about 95% will be found within two standard deviations of the mean. Finally, there is a 99.7% likelihood that the sample will fall within three standard deviations of the mean.
Normal distribution and standard deviation functions in expert advisors (EA) and trading systems help forex traders assess the probability that prices may move a certain amount during a given period of time.
Yet, traders should be cautious when using the concept of normal distribution alone for purposes of risk management. Even though the probability of a rare event (such as a price decrease of 50%) may seem low, unforeseen marketplace factors can make the possibility much higher than it appears during normal distribution calculations.
Reliability of analysis depends on quantity and quality of data
When modelling normal distribution curves, the amount and quality of input price data is very important. The greater the number of samples, the smoother the curve will be. Also, to avoid calculation errors resulting from insufficient data, it’s important that each calculation be based on at least thirty samples.
So, for testing a forex-trading strategy by estimating the results from sample trades, the system developer must analyze at least 30 trades in order to reach statistically-reliable conclusions regarding the parameters being tested. Likewise, the results from a study of 500 trades are more reliable than those from an analysis of only 50 trades.
Dispersion and mathematical expectation to estimate risk
For forex traders, the most important characteristics of a distribution are its mathematical expectation and dispersion. Mathematical expectation for a series of trades is easy to calculate: Just add up all the trade results and divide that amount by the number of trades.
If the trading system is profitable, then the mathematical expectation is positive. If the mathematical expectation is negative, the system is losing on average.
The relative steepness or flatness of the distribution curve is shown by measuring the spread or dispersion of price values within the area of mathematical expectation. Typically, the mathematical expectation for any randomly-distributed value is described as M(X).
So, dispersion can be defined as D(X) = M[(X-M(X)]2.
And, a dispersion’s square root is called its standard deviation, shown in mathematical shorthand as sigma (σ).
Dispersion and standard deviation are critically important for risk management in forex trading systems. The higher the value of the standard deviation, the higher will be the potential drawdown, and the higher the risk. Likewise, the lower the value for standard deviation, the lower will be the drawdown while trading the system.
For example, below is a sample risk assessment for a test of a forex trading system:
Trade Number X (Trade Gain or Loss)
1 -17.08
2 -41.00
3 147.80
4 -159.97
5 216.97
6 98.30
7 -87.75
8 -27.83
9 12.34
10 48.14
11 -60.92
12 10.62
13 -125.43
14 -27.82
15 88.02
16 32.94
17 54.82
18 -160.10
19 -83.37
20 118.40
21 145.65
22 48.43
23 77.39
24 57.49
25 67.75
26 -127.10
27 -70.19
28 -127.60
29 31.31
30 -12.55
In the above example based on the minimum number of thirty trades for an adequate sample, it’s important to note that the mathematical expectation is positive, so the forex trading strategy is indeed profitable.
However, the standard deviation is high, so in order to earn each dollar the trader is risking a much larger amount; this system carries significant risk.
Here’s the rest of the math: To determine the mathematical expectation for this group of trades, add together all the trades’ gains and losses, then divide by 30. This is the mean value M(X) for all the trades. In this case, it equals an average gain of $4.26 per trade. Thus far, the system looks promising.
Next, to calculate the standard deviation of the dispersion, the above average $4.26 is subtracted from the results of each trade, then it’s squared, and the sum of all these squares is added together. The sum is divided by 29, which is the total number of trades minus 1.
By using the formula for Dispersion of (X) = M[(X-M(X)]2 given above, here’s a check of the calculation from the first trade in our example:
Trade 1: -17.08 – 4.26 = -21.34, and (-21.34)2 = 455.39
The same calculation is performed for each trade in the test series. In this example, the dispersion over the series equals 9,353.62 and by definition its square root equals the standard deviation (σ), which in this case is $96.71.
Thus the forex trader sees that the risk for this particular system is fairly high: The mathematical expectation is indeed positive, with a mean profit of $4.26 per trade, yet the standard deviation is high when compared with that profit.
It can be seen that the trader is risking about $96.71 for each opportunity to earn $4.26 in profit. This risk may be acceptable, or the trader may choose to modify the system in search of lower risk.
Z-score
Beyond the riskiness of a particular trading system, forex traders can also use normal distribution and standard deviation to calculate the Z-score, which indicates how often profitable trades will occur in relation to losing trades.
During the process of developing a winning forex trading system, the trader may wonder how many of the profitable trades seen during testing were “random,” and how many consecutive losing trades must be tolerated in order to achieve winning trades.
For example, let’s assume the average expected profit from a given forex trading system is four times less than the expected loss amount from each stop-loss order triggered while trading this system.
Some traders may assume that the system will win over time, as long as there is an average of at least one profitable trade for each four losing trades. Yet, depending upon the distribution of wins and losses, during real-world trading this system may draw down too deeply to recover in time for the next winner.
Normal distribution can be used to generate a Z-score, sometimes called a standard score, which lets traders estimate not only the ratio of wins to losses, but also how many wins/losses are likely to occur consecutively.
A positive Z-score represents a value above the mean, and a negative Z-score represents a value below the mean. To obtain this value, the trader subtracts the population mean from an individual raw value then divides the difference by the population standard deviation.
The basic standard score calculation for a raw score designated as x is:
Z = (x – μ) / σ
Where μ is the population mean and σ is the population standard deviation. It’s important to understand that calculating the Z score requires that the trader know the parameters of the population, not merely the characteristics of a sample taken from that population.
Z represents the distance between the population mean and the raw score, expressed in units of the standard deviation. So, for a forex trading system:
Z = [N x (R – 0.5) – P] / [(P x (P – N)] / (N – 1)]½
When:
N is the total number of trades during a series;
R is the total number of series of winning and losing trades;
P equals 2 x W x L
W is the total number of winning trades during a series
L is the total number of losing trades during a series
Individual series can be represented by a consecutive sequence of pluses or minuses (for example ++++ or —). R counts the number of such series.
Z can offer an assessment of whether a forex trading system is operating on-target, or how far off-target it may be.
Just as importantly, a trader can use Z-score to determine whether a trading system contains fewer or greater series of winners and losers than expected from a random sequence of trades– In other words, whether the outcomes of consecutive trades are dependent upon each other.
If the Z-score is near 0, then the distribution of trade results is near the normal distribution. The score of a sequence of trades may indicate a dependency between the results of those trades.
This is because a normal random value will deviate from the average value by not more than three sigma (3 x σ) with a certainty of 99.7%. Whether the Z value is positive or negative will inform the trader about the type of dependence: A positive Z value indicates that the profitable trade will be followed by a loser.
And, positive Z indicates that the profitable trade will be followed by another profitable one, and a loser will be followed by another loss. This observed dependency lets the forex trader vary the position sizes for individual trades in order to help manage risk.
Sharpe Ratio
The Sharpe Ratio, or reward-to-variability ratio, is one of the most valuable probability tools for forex traders. As with the methods described above, it relies on applying the concepts of normal distribution and standard deviation. It gives traders a method to check the performance of a trading system by adjusting for risk.
The first step is to calculate the Holding Period Returns (HPR). For example, a trade which resulted in a profit of 10% has a HPR calculated as 1 + 0.10 = 1.10 while a trade which loses 10% is calculated as 1 – 0.10 = 0.90.
Likewise, HPR can be calculated by dividing the after-trade balance amount by the before-trade amount. The Average Holding Period Returns (AHPR) is then calculated by adding up all individual holding-period returns, then dividing by the number of trades.
AHPR by itself produces an arithmetic average which may not properly estimate the performance of a forex trading system over time. Instead, a trading system’s investment efficiency can be more closely estimated by using the Sharpe Ratio, which shows how AHPR minus the risk-free rate of long-term investment returns relates to the standard deviation of the trading system.
Sharpe Ratio = [AHPR – (1 + RFR)] / SD
When AHPR is the average holding period return, RFR is the risk-free rate of return from “safe” investments such as bank interest rates or long-term T-bond rates, and SD is the standard deviation.
Since more than 99% of all random values will fall within a distance of ±3σ around the mean value of M(X) for a given trading system, the higher the Sharpe Ratio, the more efficient the trading system.
For example, if the Sharpe Ratio for normally-distributed trade results is 3, it indicates that the probability of losing is less than 1% per trade, according to the 3-sigma rule.
The concepts of normal distribution, dispersion, Z-score and Sharpe Ratio are already incorporated into the logarithms of EAs and mechanical trading systems, and their usefulness is invisible to most traders.
Yet, by knowing how these basic probability tools work, forex traders can have a deeper understanding of how automated systems perform their functions, and thereby enhance the probability of winning trades.
Are you currently using probability tools to increase your own chance for success?


