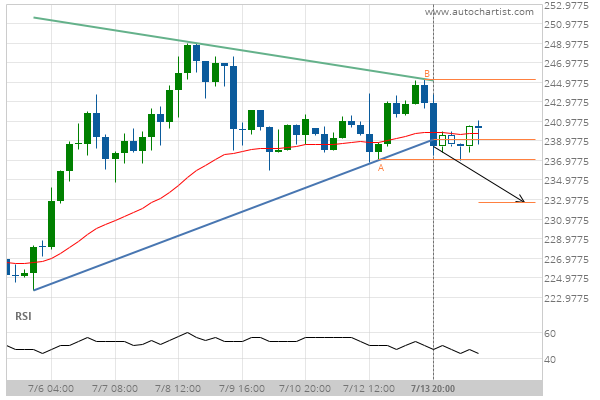
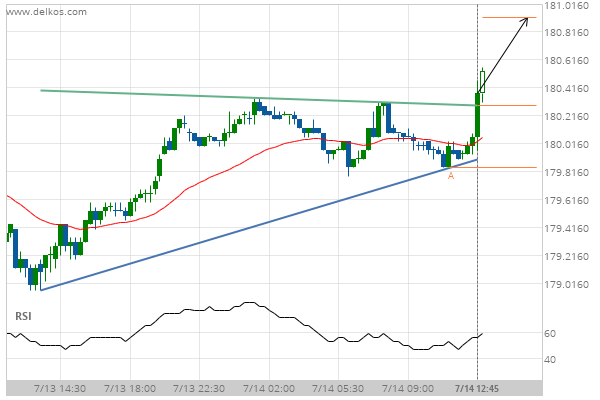
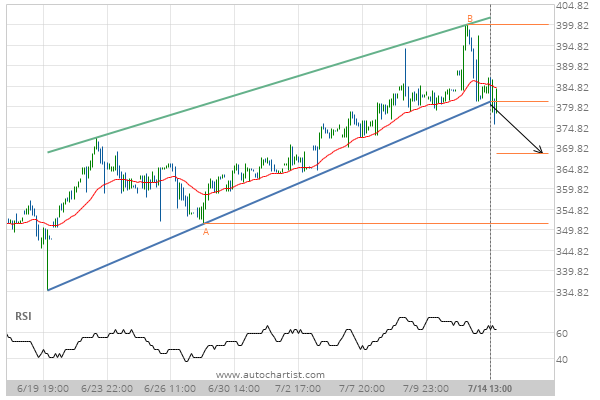
ETHUSD has broken through the support line of a Triangle technical chart pattern. Because we have seen it retrace from this position in the past, one should wait for confirmation of the breakout before trading. It has touched this line twice in the last 9 days and suggests a target line to be around 232.6529 within the next 2 days.
Related Posts
Important price line being approached by DASHUSD. This price has been tested numerous times before.
The price of DASHUSD in heading back to the support area. It is possible that it will struggle…
After testing the resistance line numerous times, ETHJPY is once again approaching this line. Can we expect a bullish trend to follow?
An emerging Channel Up has been detected on ETHJPY on the 4 hour chart. There is a possible…
If you’re long LTCBTC you should be aware of the rapidly approaching level of 9.9530E-04
A strong support level has been identified at 9.9530E-04 on the 4 hour LTCBTC chart. LTCBTC is likely…

