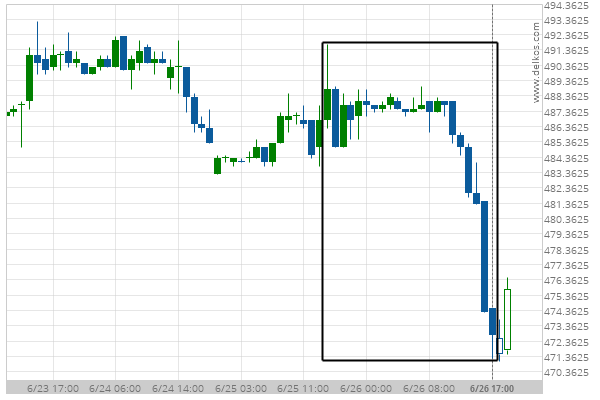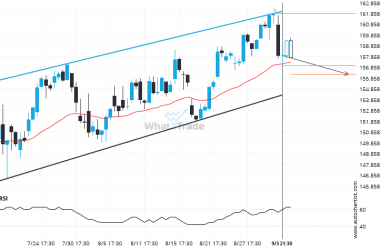
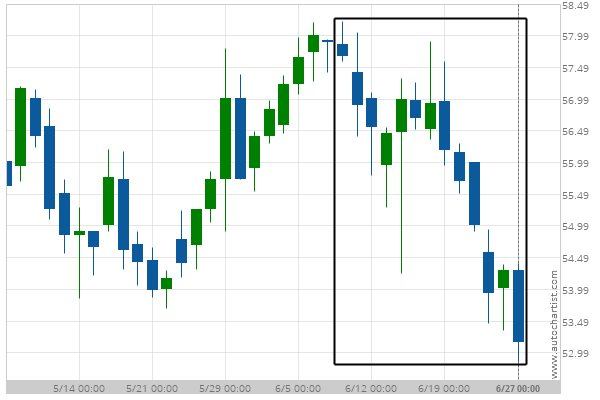
Verizon Communications Inc. has experienced an exceptionally large movement lower by 7.82% from 57.85 to 53.15 in the last 18 days.
Could a large bearish move on Verizon Communications Inc. be a sign of things to come?

Verizon Communications Inc. has experienced an exceptionally large movement lower by 7.82% from 57.85 to 53.15 in the last 18 days.