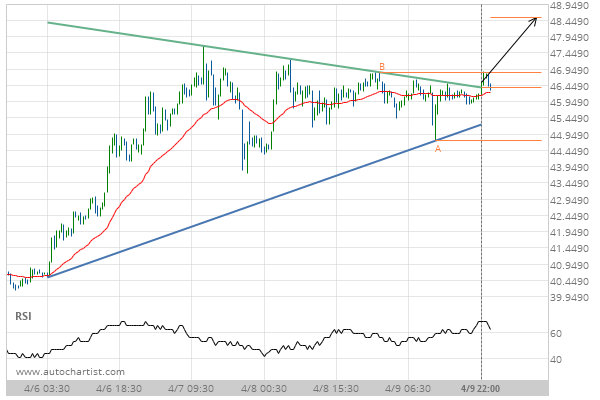
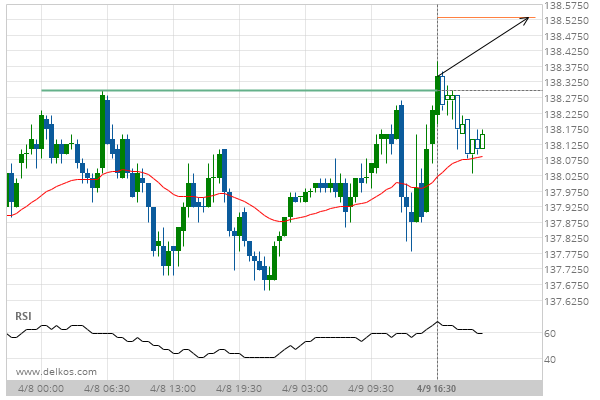
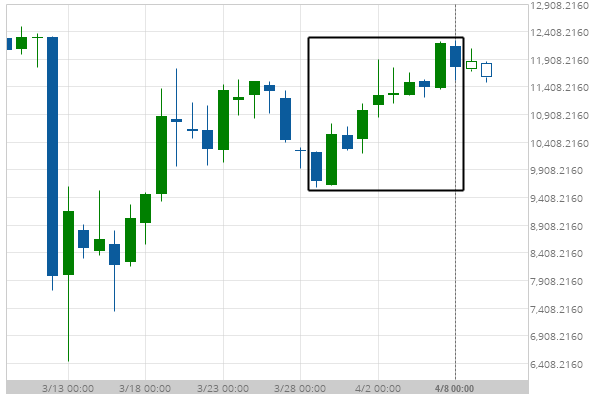
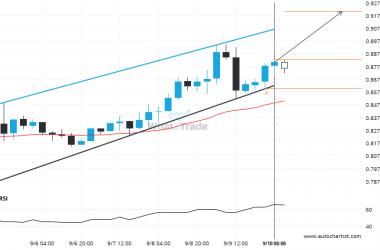
LTCUSD has broken through the resistance line of a Triangle technical chart pattern. Because we have seen it retrace from this position in the past, one should wait for confirmation of the breakout before trading. It has touched this line twice in the last 4 days and suggests a target line to be around 48.5296 within the next 2 days.
Related Posts
Bulls aim for 604.3920 after the BCHUSD triggered a bullish formation on the 1 hour chart
The last 7 1 hour candles on BCHUSD formed a Channel Down pattern and broken out through the…
If ETHAUD touches 6483.2002 it may be time to take action.
The movement of ETHAUD towards 6483.2002 price line is yet another test of the line it reached numerous…
ADAUSD – approaching a resistance line that has been previously tested at least twice in the past
ADAUSD is trapped in a Channel Up formation, implying that a breakout is Imminent. This is a great…

