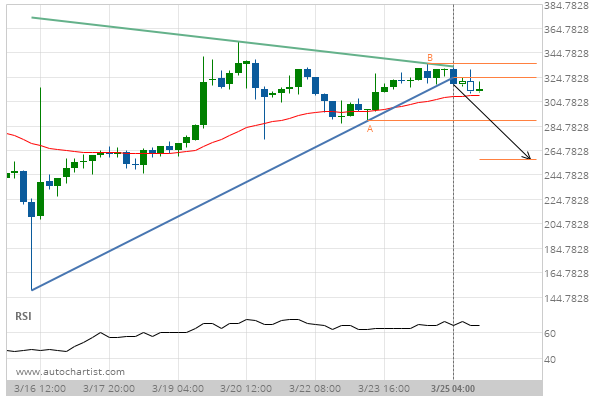
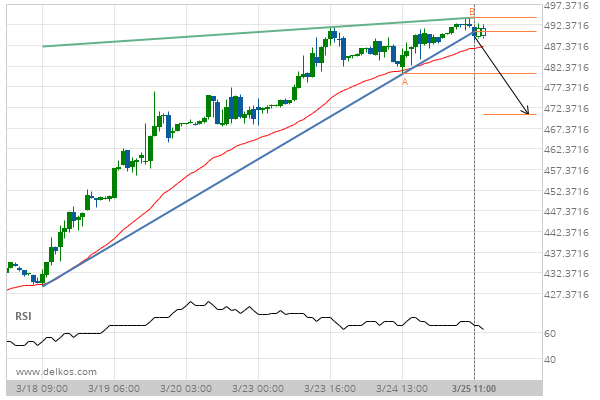
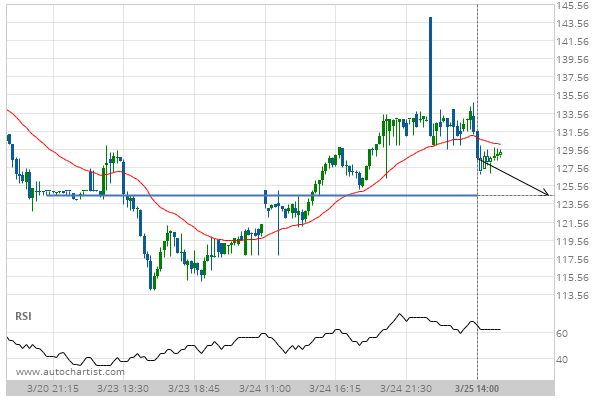
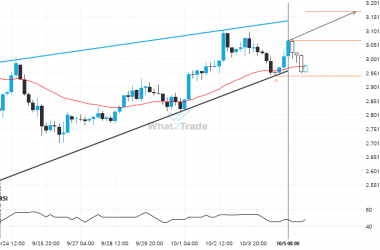
BCHCAD has broken through a support line of a Triangle and suggests a possible movement to 257.6736 within the next 3 days. It has tested this line in the past, so one should probably wait for a confirmation of this breakout before placing a trade. If the breakout doesn’t confirm, we could see a retracement back to lines seen in the last 9 days.
Related Posts
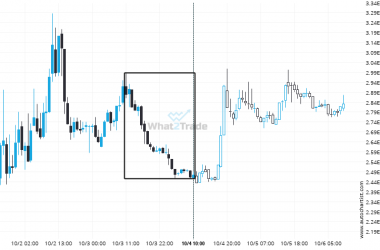
DASHBTC experienced a 14.01% bearish move in just 23 hours. The magnitude speaks for itself.
DASHBTC recorded a considerable move in the last 23 hours — one of its biggest in recent sessions.
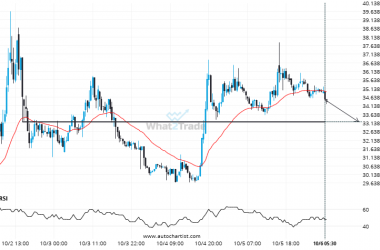
Supports and resistances are primary concepts of technical analysis. DASHUSD is heading for an important price of 33.2000 – read about what this could mean for the future.
DASHUSD is heading towards 33.2000 and could reach this point within the next 20 hours. It has tested…
XRPUSD – approaching a resistance line that has been previously tested at least twice in the past
An emerging Rising Wedge has been detected on XRPUSD on the 4 hour chart. There is a possible…

