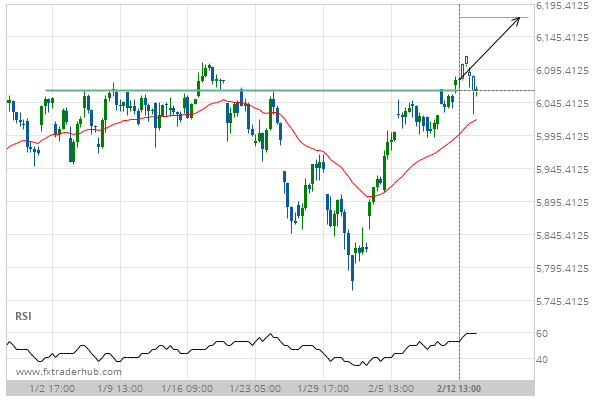
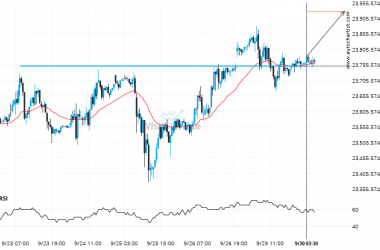
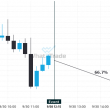
FRA40 has broken through the resistance line of a Resistance. Because we have seen it retrace from this position in the past, one should wait for confirmation of the breakout before trading. It has touched this line numerous times in the last 42 days and suggests a target line to be around 6174.7500 within the next 4 days.
Related Posts
Interesting opportunity on UK100 after breaking 8375.530534351145
UK100 has broken through a support line of a Rising Wedge chart pattern. If this breakout holds true,…
Interesting opportunity on NAS100 after breaking 18158.375
Triangle pattern identified on NAS100 has broken through a support level with the price momentum continuing to move…
Bulls aim for 8206.1736 after the FRA40 triggered a bullish formation on the Daily chart
Triangle pattern identified on FRA40 has broken through a resistance level with the price momentum continuing to move…