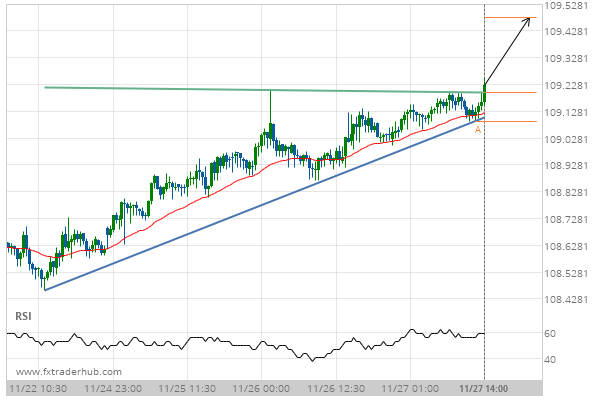
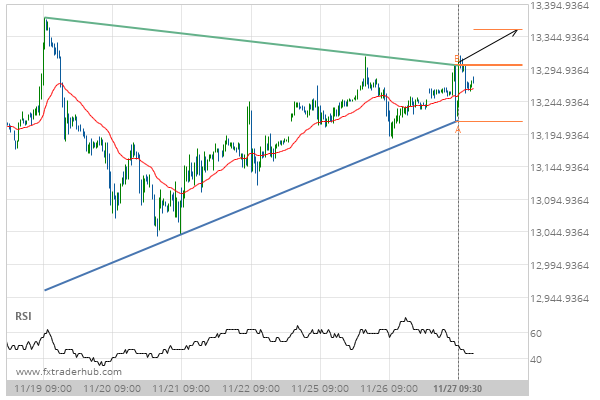
USD/JPY has broken through a resistance line of a Ascending Triangle chart pattern. If this breakout holds true, we expect the price of USD/JPY to test 109.4772 within the next 2 days. But don’t be so quick to trade, it has tested this line in the past, so you should probably confirm the breakout before placing any trades.
Related Posts
A possible move on NZDUSD as it heads towards resistance
A Rising Wedge pattern was identified on NZDUSD at 0.59518, creating an expectation that it may move to…
GBPCHF seems to be on its way to resistance – a possible opportunity?
GBPCHF is about to retest a key horizontal resistance level near 1.0843. It has tested this level 4…
Because USDJPY formed a Channel Down pattern, we expect it to touch the resistance line. If it breaks through resistance it may move much higher
USDJPY is heading towards the resistance line of a Channel Down and could reach this point within the…

