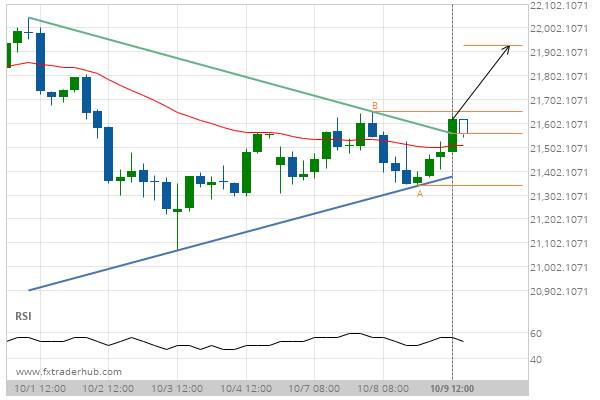
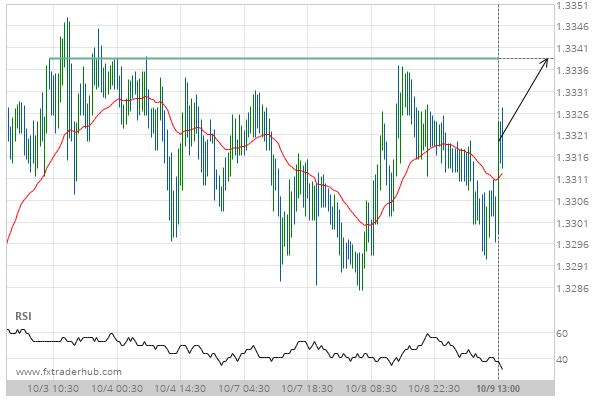
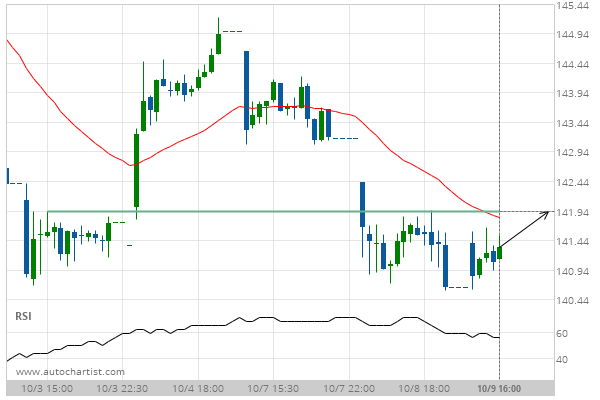
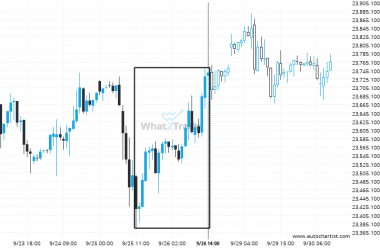
JPN225 has broken through a resistance line of a Triangle and suggests a possible movement to 21926.3540 within the next 2 days. It has tested this line in the past, so one should probably wait for a confirmation of this breakout before placing a trade. If the breakout doesn’t confirm, we could see a retracement back to lines seen in the last 9 days.
Related Posts
DOW 30 is approaching 46089.0000. We expect either a breakout through this line, or a rebound.
DOW 30 is heading towards a line of 46089.0000. If this movement continues, the price of DOW 30…
After testing resistance twice in the past, DOW 30 has finally broken through. Can we expect a bullish trend to follow?
DOW 30 has broken through a resistance line of a Triangle and suggests a possible movement to 46612.9534…
Extreme movement experienced on DAX 40. Check the chart to see what to do next.
DAX 40 just posted a 1.37% move over the past 2 days – a move that won’t go…

