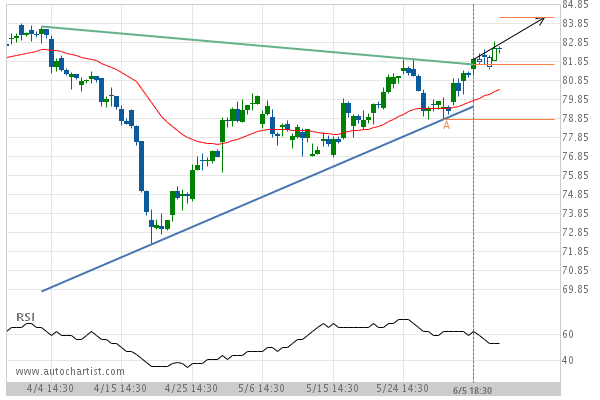
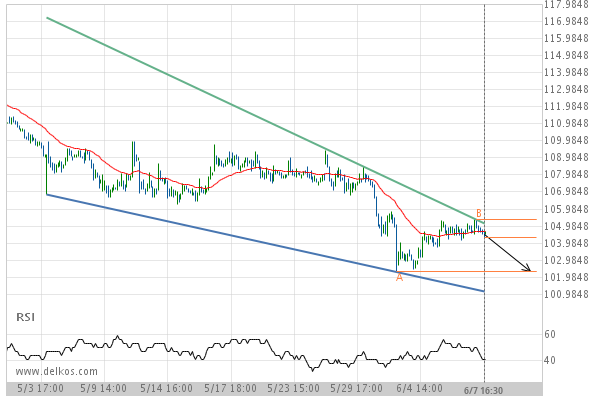
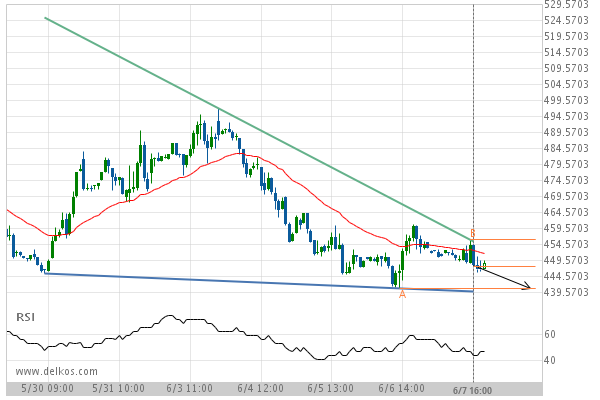
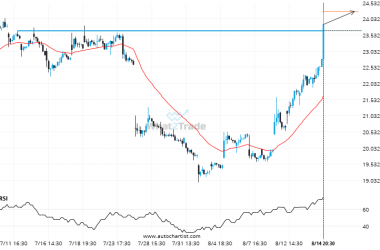
Merck & Co. Inc. has broken through the resistance line of a Triangle. It has touched this line at least twice in the last 64 days. This breakout indicates a potential move to 84.13 within the next 3 days. Because we have seen it retrace from this positions in the past, one should wait for confirmation of the breakout before trading.
Related Posts
MSFT seems to be on its way to resistance – a possible opportunity?
MSFT is en route to a very important line that will be a definite deciding factor of what…
Because AVGO formed a Rising Wedge pattern, we expect it to touch the resistance line. If it breaks through resistance it may move much higher
An emerging Rising Wedge has been detected on AVGO on the 1 hour chart. There is a possible…
If you’re short INTC you should be aware that 23.6600 has just been breached – a level tested 4 time in the past
INTC has broken through a line of 23.6600 and suggests a possible movement to 24.2670 within the next…

