Receive the latest alerts via email

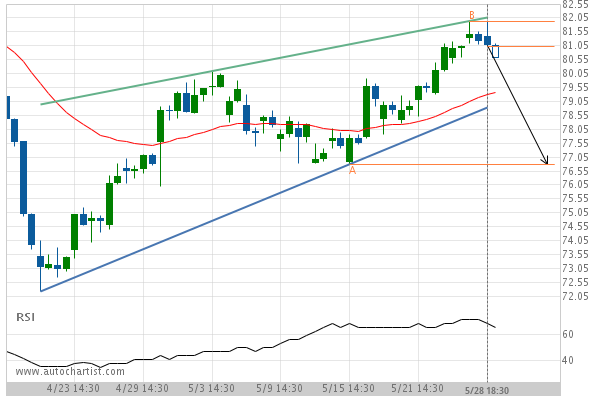
USD/JPY Target Level: 109.2040

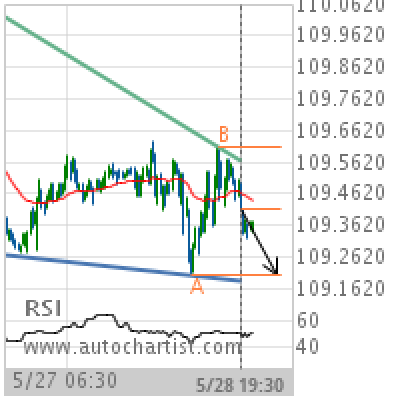
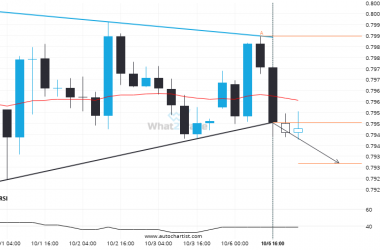
Falling Wedge identified at 28-May-2019 19:30 UTC. This pattern is still in the process of forming. Possible bearish price movement towards the support 109.2040 within the next day. Supported by Downward sloping Moving Average Chart 30 MinutesPattern Falling WedgeLength 169 CandlesIdentified 28-May-2019 19:30 UTC
USD/JPY Target Level: 109.2040

Falling Wedge identified at 28-May-2019 19:30 UTC. This pattern is still in the process of forming. Possible bearish price movement towards the support 109.2040 within the next day. Supported by Downward sloping Moving Average

Chart 30 Minutes
Pattern Falling Wedge
Length 169 Candles
Identified 28-May-2019 19:30 UTC

Total
0
Shares
Previous Post

Important support line being approached by Merck & Co. Inc.. This price has been tested numerous time in the last 41 days

Next Post

BTCCAD is quickly approaching the support line of a Channel Up. We expect either a breakout through this line or a rebound.

Related Posts