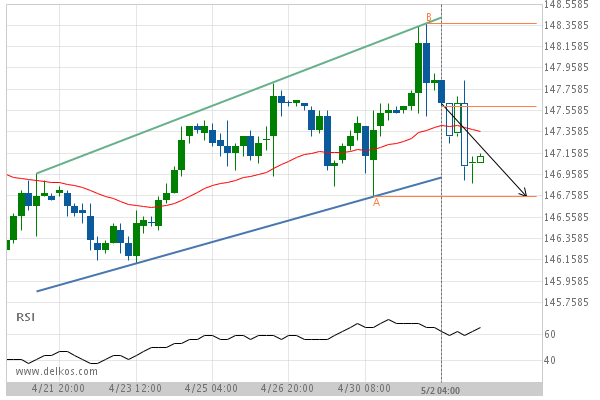
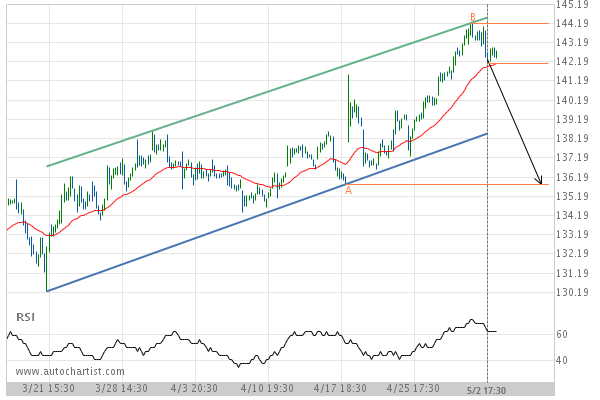
Channel Up identified at 02-May-2019 17:30 UTC. This pattern is still in the process of forming. Possible bearish price movement towards the support 135.80 within the next 3 days.
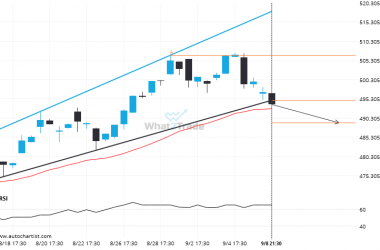
Travelers Cos Inc. Target Level: 135.80

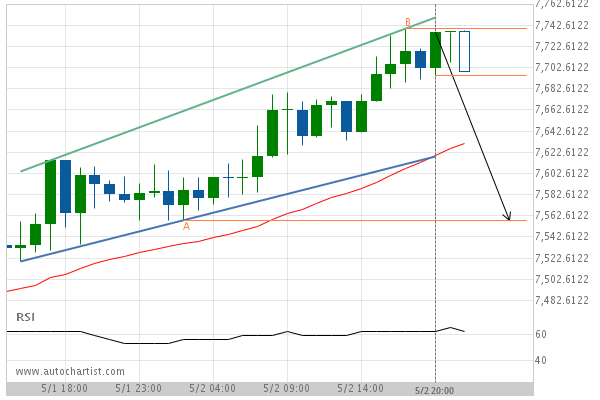
Channel Up identified at 02-May-2019 17:30 UTC. This pattern is still in the process of forming. Possible bearish price movement towards the support 135.80 within the next 3 days.